This winter has not had a fair share of wintry events. The snowfall we have received has generally come from clipper systems, and the larger storm systems have been rain. But the weather pattern is changing towards one that favors major east coast storm development and potentially large snowfall events. It is not a slam-dunk by any means, since there are a lot of moving parts, but the pattern over the next few weeks certainly piques the interest of any meteorologist looking for potential winter weather events.
One of the main problems for getting major snowstorms this winter has been the very fast flow across the Pacific and Atlantic basins. This means that any large storm that tried to amplify would get flattened out, as any ridging in the Pacific would get flattened like a pancake. This is going to change as we head towards this weekend.
While our area has been enjoying a stretch of pleasant and warmer weather, many meteorologists and weather hobbyists alike have been analyzing interesting data in the Equatorial Pacific: signs of a developing El Nino. An El Nino is generally defined as a trimonthly period where waters in the Equatorial Pacific — from 160 Degrees East to 80 Degrees West Longitude — are warmer than normal. This tends to have effects on the general atmospheric circulation, which will be detailed in this article. The Climate Prediction Center breaks this area into four different Nino regions, since warm anomalies in different regions of the Equatorial Pacific can lead to subtle, yet important changes in how the El Nino behaves.
The four El Nino regions (NCDC).
The region used to officially define an El Nino event is Nino 3.4, which spans from about 170 Degrees West to 120 Degrees West. That is not to say that the other regions are not important; they are just not used in the official calculation. Let’s take a look at an example of an El Nino event:
The strong El Nino event of 1997-1998. Notice how warm the waters are in the eastern Equatorial Pacific (CPC).
The El Nino of 1997-1998 was the strongest on record, as it had temperature anomalies between +2C and +5C across the eastern Equatorial Pacific. Also notice how the warmest anomalies were east of Nino region 3.4, which is a classic strong El Nino phenomenon. Let’s see how the forecast from one of our climate models compares to the 1997-1998 event.
The latest CFS model run shows an El Nino emerging (CPC).
The values on the left are anomalies in Kelvin, which can also be represented by degrees Celsius, since the incremental increases are the same for Kelvin and degrees Celsius. On the bottom, we see tri-monthly periods. The wavy black line shows what had previously been happening — generally, there was no anomaly at all, indicating no El Nino, nor its counterpart, a La Nina. However, moving forward in time, notice how all of the lines, which represent forecasting members, show a pretty fast increase in the anomaly through the coming months. Another interesting point is how the red lines are the earlier members, and the blue lines are the latest members — and there appear to be more blue members hedging towards the warmer side of the mean than the red lines — which is perhaps an indicator of a further warming trend.
The threshold for a strong El Nino is an anomaly of +1.5C or higher, which certainly seems attainable according to the CFS. While not nearly as strong as the 1997-1998 El Nino, it would certainly still be pretty strong, and the fact that the latest members look warmer than the mean indicates that the El Nino could verify warmer than the forecast mean.
Now that we know what an El Nino is, as well as how strong it is forecast to become, let’s examine what causes an El Nino, and what effects it has on our weather pattern. Read more
https://www.nymetroweather.com/wp-content/uploads/2024/02/Empire-2000-x-300-px-2.png00Doug Simonianhttps://www.nymetroweather.com/wp-content/uploads/2024/02/Empire-2000-x-300-px-2.pngDoug Simonian2014-04-10 17:48:522014-05-12 06:55:49Moderate to strong El Nino becoming increasingly likely
Forecast models in the medium to long range,continue to show a pattern change throughout the northern hemisphere — characterized by a west coast ridge and a large, anomalous trough in the Eastern United States. This has been mentioned several times over the last week as our forecasters have suggested the pattern change by the end of January. Exactly how the pattern plays out remains a mystery at this juncture, especially as some continue to overanalyze and interpret operational model guidance — which is never smart. The individual nuances of the pattern are going to take days to iron out.
The first development of note is that the ECMWF has finally caved to the GFS and GEFS interpretation of tropical forcing which will increase later this week and help the development of some major pattern changes. The ECMWF had previously been very stubborn in insisting against this development and keeping the impulse quite week. This cave is very important for the eventual changes in the Pacific including the development of a +PNA regime (i.e the west coast ridge).
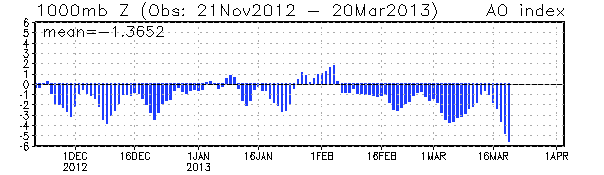
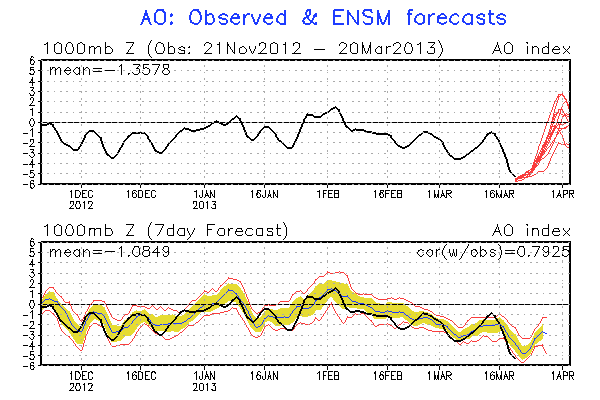
The Arctic Oscillation readings over the last several months show the dramatic and unrivaled drop in readings during mid March 2013.
The Arctic Oscillation (AO) has fallen off the cliff in the last week, as incredible high latitude blocking ridges have developed both north of Alaska and over Greenland. The AO fell below -5.0 to -5.632 on March 20th, 2013 — making it by far the lowest reading after March 15th in the history of the AO’s recorded values. It also remains, historically, the lowest AO after March 6th.
GFS Model observed (black) and forecast (red) AO values
The Arctic Oscillation, or AO, refers to the generally opposing pattern between pressure in the northern-middle latitudes and the Arctic. It is a climate pattern, that is characterized by counterclockwise winds which circulate around the Arctic near 55°N. The phase and degree of amplitude of the Arctic Oscillation can be a very useful forecasting tool, especially in the winter season. During a positive phase AO, a belt of strong winds circulating around the pole often acts to keep cold air confined to our north. But a negative AO opens the proverbial flood gates for the arctic air to penetrate much farther south.
It should come as no surprise, then, that this strongly negative AO phase has been accompanied by the presence of unseasonably cold air. The forecast, holds the potential for cold air through the next 7 days with chances for snow. The GFS ensemble and most medium range global models forecast the AO to rise over the next 7 days. Although it is typical for the AO to rise and fall rather consistently, the dramatically low values are being accompanied by rather high return values to normal, and in some cases a positive phase of the AO. Regardless, It remains to be seen if the wintry weather threats will work out Still, one thing is for sure: we are in uncharted territory as far as the Arctic Oscillation goes, for this late in the season.
For more on the Arctic Oscilation check out this article, which details the different phases and amplitudes.
https://www.nymetroweather.com/wp-content/uploads/2024/02/Empire-2000-x-300-px-2.png00John Homenukhttps://www.nymetroweather.com/wp-content/uploads/2024/02/Empire-2000-x-300-px-2.pngJohn Homenuk2013-03-20 11:23:152013-03-20 11:23:15AO Falls to lowest value ever for Mid March
Hi friends! Our website uses cookies to provide an optimal browsing experience for you. New "Cookie Consent" laws mandate us to inform you of this. As long as you're cool with it, just hit OK. You'll only see this message once.
We may request cookies to be set on your device. We use cookies to let us know when you visit our websites, how you interact with us, to enrich your user experience, and to customize your relationship with our website.
Click on the different category headings to find out more. You can also change some of your preferences. Note that blocking some types of cookies may impact your experience on our websites and the services we are able to offer.
Essential Website Cookies
These cookies are strictly necessary to provide you with services available through our website and to use some of its features.
Because these cookies are strictly necessary to deliver the website, refusing them will have impact how our site functions. You always can block or delete cookies by changing your browser settings and force blocking all cookies on this website. But this will always prompt you to accept/refuse cookies when revisiting our site.
We fully respect if you want to refuse cookies but to avoid asking you again and again kindly allow us to store a cookie for that. You are free to opt out any time or opt in for other cookies to get a better experience. If you refuse cookies we will remove all set cookies in our domain.
We provide you with a list of stored cookies on your computer in our domain so you can check what we stored. Due to security reasons we are not able to show or modify cookies from other domains. You can check these in your browser security settings.
Other external services
We also use different external services like Google Webfonts, Google Maps, and external Video providers. Since these providers may collect personal data like your IP address we allow you to block them here. Please be aware that this might heavily reduce the functionality and appearance of our site. Changes will take effect once you reload the page.
-2")