-2")
What Explains the Convective Cumulus Clouds we had Yesterday?
Convective cumulus clouds were observed throughout the area on Monday, and many areas saw snow pellets falling despite temperatures in the upper 40’s to near 50. Some very interesting atmospheric processes were at work to cause this, which we detail below.
Skies finally cleared somewhat on Monday behind our departing storm system. As some of you may have noticed, we observed lots of cumulus clouds today, almost as if it were summer, despite relatively chilly temperatures. Additionally, they actually had pretty good, organized vertical structure (although not towering), and some were quite dark. Isn’t this usually a summer time convection phenomenon? What explains this?
This is where it is very important to look at what we call lapse rates. Lapse rates are the difference in temperature between two given heights in the atmosphere. Thus, a steep lapse rates means that there is a great difference in temperature between the bottom of the given layer and the top of the given layer. Mathematically, they are actually the negative of the difference in temperature divided by the change in height, since temperatures generally decrease with height. Thus, when temperatures rapidly decrease as you increase in height, you have a strong, positive lapse rate. When lapse rates are strongly positive, that means the atmosphere is very unstable.
Now, let’s apply this to the atmosphere. There is the cliche that warm air rises and cold air sinks, and this is because cold air is more dense than warm air. Thus, when an air parcel (a sample of air) is heated at the surface, it will have the tendency to rise. And if that heated parcel is rising into air that is rapidly getting colder with height, that means the parcel will have a tendency to keep rising, since it is much warmer than the air around it and above it during its rise. Thus, steep lapse rates means that you have rapidly rising air.
Usually, when we evaluate the stability of the atmosphere, we like to start with the ground layer, since the ground is what traps sunlight and heats most efficiently. If we know the temperature at the ground is much warmer than the temperatures in the mid levels of the atmosphere, then we have an unstable atmosphere and rapidly rising air. Let’s take a look at the atmospheric conditions and see if we have these phenomena taking place.
The 500mb pattern from 5 p.m yesterday shows a cold pool at that level in our area, one factor that leads to atmospheric instability.
A quick clue by just looking at a computer model for potential instability is an upper level cold pool. One way we can find this is locating an area of low geopotential heights. This image gives us the 500mb pattern from 5:00 p.m. yesterday. As you can see, there are very low geopotential heights over the Northeast, especially considering the time of year; between 528 and 540 dam. These height contours are closed and attached to the departing upper level low that helped to keep our previous storm system suppressed. This is an example of an upper level cold pool, as low geopotential heights represents cold temperatures. Diving in a bit deeper, this is because the height from the ground to 500mb of pressure is relatively low, and when the height at a given pressure is lower, that means the air at that given layer isn’t as expansive. And we know that warm air expands and cool air contracts, so a less expansive layer of air is inherently colder.
For more clarity, we can look at a sounding, which shows the temperatures at all layers of the atmosphere. A good benchmark of a very steep lapse rate is one that follows what we call the dry adiabat. A dry adiabat on a sounding are the solid, negatively sloped gray lines. The dry adiabatic lapse rate is 9.8 degrees Celsius per 1000 meters. This is very steep and occurs when a dry air parcel is forced to rise adiabatically; that is, when no heat is being added or removed from the system.
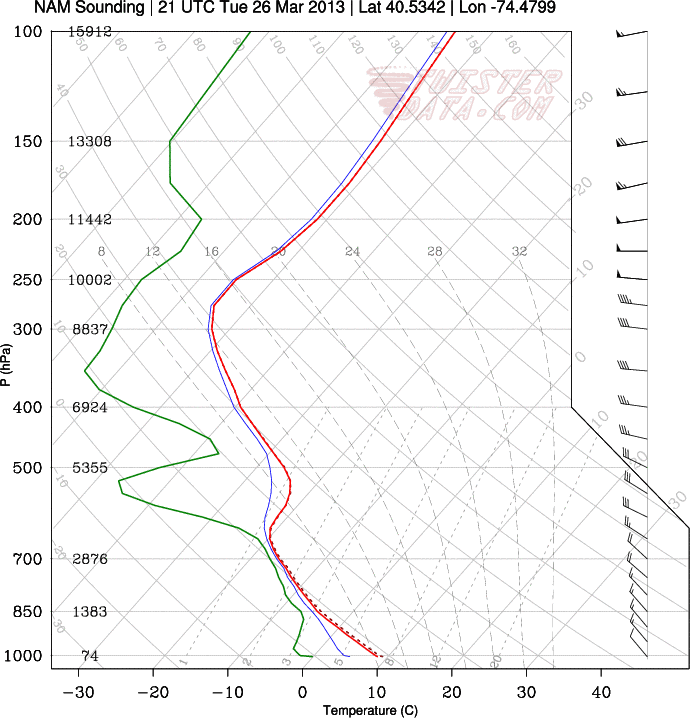
This is an atmospheric sounding in Central NJ valid for 5 p.m., yesterday. The red line represents temperature, the green line represents dewpoint, and the blue line in between is the wetbulb temperature.
Anyway, this sounding was valid for Central NJ at 5 p.m. As you can see, the temperature line is following the dry adiabat to the tee from the surface up through above 800mb, and nearly continues that rate all the way up to 700mb! That means that the atmosphere is nearly dry adiabatic for 300mb, which is a very large layer of instability. We go from nearly 10 degrees C at the surface to about -18 degrees C at 700mb. As some of you know, rapidly rising air is a process that can yield cloud formation, especially ones of the convective, cumulus variety. We were under a unique situation where the mid and upper levels of the atmosphere were very cold due to the departing upper level low, and the temperatures at the surface were relatively warm, since the late March sun angle allows the ground to be heated a lot more than what is typical for weather patterns that have such powerful upper level lows.
Getting a bit more technical, we know steep lapse rates can lead to convective cloud formation because this means that an air parcel will reach its LCL (lifted condensation level) low in the atmosphere. Those dotted, positively sloped lines represent the mixing ratio, which essentially represents moisture in the atmosphere. To find the LCL, you draw a line from the surface dewpoint (bottom of the green line) of the same slope as the mixing ratio (so that it runs parallel to the given mixing ratio lines). You also draw a line from the surface temperature (bottom of the red line) of the same slope as the dry adiabat (so that it runs parallel to the given dry adiabats). Where those two lines intersect is your LCL. However, as stated before, in this sounding, the lapse rates are dry adiabatic low in the atmosphere, so the “temperature” line we are drawing overlaps the red temperature line exactly. Thus, to save time, we can just draw the first line until it hits the red temperature line. This pressure level we obtained is where the air parcels will start to condense and clouds will form. If we do this, we get an LCL of around 875mb, with lots of steep lapse rate still left above it. That means when the air parcels are condensing to form clouds, they are still rising rapidly, thus clouds are able to grow vertically quite quickly, and this is what yields cumulus clouds. This large area of organized lift is what yielded such beautiful cumulus clouds.
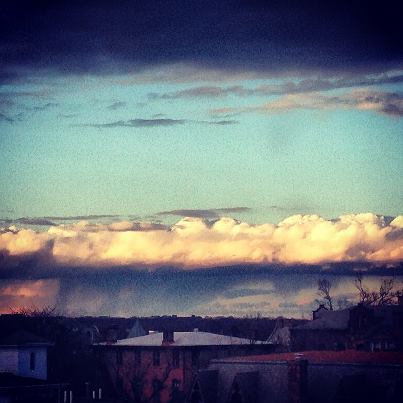
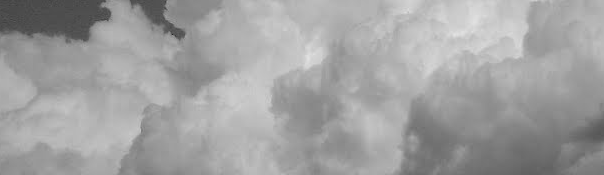
This photo was taken yesterday evening. It shows the gorgeous, organized layer of cumulus clouds and a darker rain shaft beneath it; a product of the unstable atmosphere. Photo credit goes to Shawnie Caslin.
The lapse rates start to rapidly decrease at around 600mb, which is where most of the clouds will stop growing, unless there is enough energy to overcome that. To prevent boredom, I will not overly elaborate on that. But please feel free to contact us if you are curious as to why and I will gladly elaborate. Additionally, considering the dewpoint line is very close to the temperature line above the LCL, that means the clouds are very moist. Sunshine does not penetrate through water droplets as well as it does through dry air, and it also scatters, which is why some of the cumulus clouds today were dark.
Because of all of this organized, efficient lift that we had in the atmosphere, along with the moisture we had above the LCL, and the stable layer at 600mb, we saw images like this one: beautiful cumulus clouds with dark bases and rain shafts, along with a peaceful blue sky “stable” layer above them. These organized cumulus clouds are atypical for this type of airmass and time of year, but I hope this article helped to somewhat explain them!
Another interesting weather phenomenon that some areas saw today was snow falling with surface temperatures in the upper 40s. This can almost completely be explained by what we just talked about. Although the surface temperatures were in the upper 40s, the steep lapse rates yielded temperatures above the surface that were much colder, meaning that throughout most of the snowflake’s descent, it had very cold temperatures. Thus, they were able to survive the warmer surface temperatures without melting. Additionally, although we had moisture above the LCL, it was relatively dry near the ground. When the difference between the surface temperature and surface dewpoint is large, that means the wetbulb temperatures are lower (the blue line in between the temperature line and dewpoint line in the sounding).
The wetbulb temperature is the temperature an air parcel would have if it were fully saturated (100% relative humidity) in that atmosphere. When precipitation falls, it is obviously saturated. When it enters that dry layer at the ground, it gets evaporated into it. As some of you know, evaporation is a “warming” process in a phase diagram. When you boil water, the water itself is warming and then evaporates into a gas. A similar thing is going on here, instead due to the dry air. The dry air evaporates the precipitation into a gas, creating a “warming” process of that precipitation. But where is this “warming” coming from? That’s coming from the drier, warmer air parcels that the precipitation is falling into. Thus, the precipitation is absorbing the warmer air as it is evaporating, which cools off the surrounding atmosphere. The drier the atmosphere is, the more efficiently that takes place, meaning the more efficiently the surrounding atmosphere cools due to precipitation. This process is called evaporative cooling. So a few minutes later when the atmosphere has cooled more, it creates a more suitable environment for a snowflake to survive to the ground. And considering how cold the temperatures were just above the ground, that made the environment even more suitable for snow, despite how warm it initially was at the surface.
Leave a Reply
Want to join the discussion?Feel free to contribute!