-2")
Winter Forecast 2014-2015
View the entire 2014-2015 Winter Forecast in a PDF file by clicking here.
You can also download it here.
Primary Methodologies and Variables of Examination
- El Nino Southern Oscillation (ENSO)
- North Atlantic Oscillation (NAO)
- Arctic Oscillation (AO)
- East Pacific Oscillation (EPO)
- Siberian/Eurasian Snow cover and Stratospheric Warming
- October Greenland Blocking
- Pacific Decadal Oscillation (PDO)
- Sea Surface Temperature Anomalies (SSTA)
Explanation of Variables
Over the past several months, our forecasters have monitored the above variables (plus others) and the trends in their behavior. We will be utilizing the above variables and indices, as well as their abbreviations, throughout the winter forecast. These variables reflect the atmospheric circulation patterns for certain geographical areas. For example, the AO refers to patterns within the Arctic Circle. The NAO refers to pattern characteristics in the North Atlantic, the PNA in the western part of North America, the PDO in the Pacific Ocean, and the EPO in the Northern and Eastern Pacific Ocean.
Typically, negative AO, NAO and EPO values correlate to enhanced high latitude blocking and high pressure to our north while lower pressure areas and troughs usually form underneath that high latitude ridging in the middle latitudes. In contrast, positive AO, NAO and EPO values generally yield lower pressure and less blocking to our north, while higher pressure and more ridging tends to build into the middle latitudes. There are exceptions to the rule, but generally the negative state of the above listed indices yields colder, more snowy weather in our area during the winter months.
Seasonal Forecasting Brief
Seasonal forecasting is one of the most convoluted aspects of meteorology. Not only is it a difficult task for the meteorologists themselves, but it is difficult for readers and public viewers to understand the nature of the forecast at times. The root of the problem lies in the fact that seasonal forecasting is based on many different methods — all of which have tremendous variability and low percentage verification. Seasonal forecasting begins with an analysis of current conditions and atmospheric circulations, similar to any daily forecast. Beyond this point, forecasters use variables such as sea surface temperature anomalies, analogs, and comparative methodology.
Some forecasters have detailed the mentality very well when they have stated that long term forecasting is very much about “What can go wrong” as opposed to “How will my forecast be correct”. Our job as meteorologists is to detail the aspects that have formed the foundation for our forecast, express our concerns and confidence in all aspects, and try to deliver the ideas which we have formulated as a result of our research and work in attempting to understand the patterns evolution over the next several months.
We will begin by highlighting several variables which we have researched. Each variable will be listed with a conclusion and prediction on its state during the winter, as well as the methodology and reasoning behind that forecast.
El Nino Southern Oscillation (ENSO)
Prediction: High likelihood Weak El Nino

The current global SSTA configuration presents a few notable areas. First, a weak El Nino is clearly visible extending from Northwestern South America along the equator. This El Nino, while weak by the numbers, remains present and generally based to the east of normal. But the past several weeks have seen a progression of above normal anomalies to the west, away from the South American Coast.
This initially looks like a phenomenon known as a Modoki El Nino This occurs when higher than normal sea surface temperature anomalies begin in the Eastern equatorial Pacific, and shift to the Central equatorial Pacific. Cooler anomalies typically surround those warmer waters over the Western and Eastern equatorial Pacific. This specific instance does not yet support the development of Modoki El Nino due to the spread and depth of above normal anomalies.
Regardless of the Modoki El Nino, medium to long range forecasting models are in moderately strong agreement that a weak El Nino will continue, by definition. Through January 2015, the CanSIPS, ECMWF, JMA, METEO, and NASA predictives all bring the El Nino Sea Surface Temperature Anomalies near 0.8 C, which is the threshold for a weak El Nino in the Nino 3.4 area.

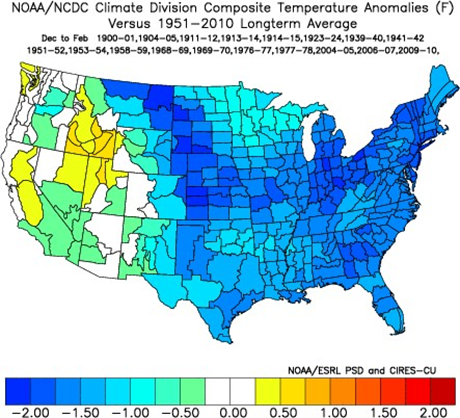
Since 1951, Weak El Ninos have provided a temperature anomaly in the United States that is noticeably cold over an area of impressive breadth.
North Atlantic Oscillation
Prediction: Predominantly negative
The current Atlantic Sea Surface Temperature configuration presents a few variables which become notable over time. First, there is a noticeable cold pool over the North Central Atlantic. This cold pool is positioned South of Greenland and east of the Canadian Maritimes. Second, that cold pool is surrounded by warmer waters, specifically from the Gulf Stream along the Eastern Seaboard of the United States and to the northeast to the Southeast of Greenland in the Northeast Atlantic Ocean.
Historically, the development of this cold pool during the month of October and its persistence into November, including the predominant warm waters surrounding it, has supported a negative NAO for the winters that follow. Below is the Surface SST composite anomaly for the Octobers preceding the 10 most negative NAO winters on record. This includes the winters of 2009-2010, 1968-1969, 1959-1960, 2012-2013, 1965-1966, 1957-1958, 1976-1977, 1978-1979, 1954-1955, and 1995-1996. These years yield an average snowfall of 35.4”.

Noticeably, the cold pool features anomalies ranging from -0.25 to -1 C. The current anomalies are of equal intensity. However, the cold pools coldest anomalies on the analog years is centered close to Eastern Canada. The current cold pool is based farther to the east, as a result of the location of persistent troughing. Warmer waters extent northward along the Eastern Canadian coast currently than they do in the average of 10 lowest NAO Octobers.
Additional research has been done on North Pacific Sea Level Pressures during El Nino Years. In this research, North Pacific Sea Level Pressures averaging below 1013mb favor a -NAO, while averages above 1013mb favor a +NAO.

Initial numbers from October in the North Pacific featured an average SLP of 1011.6 not weighted by latitude and 1012.4 weighted by latitude. Both of these values favor a moderate to strong -NAO, but much of this research depends on the El Nino’s persistence over the next few months.
Nevertheless, general analogs and sea surface temperature results for summer and autumn remain impressive. The development of the mentioned cold pool in the Atlantic during the past few weeks has been impressive and persistent. This leads to higher than normal confidence in a -NAO average this winter. Additionally, the presence of this cold pool and resulting circulation patterns leads to higher than normal confidence in the potential for high latitude blocking episodes.
Arctic Oscillation (AO)
Prediction: Negative
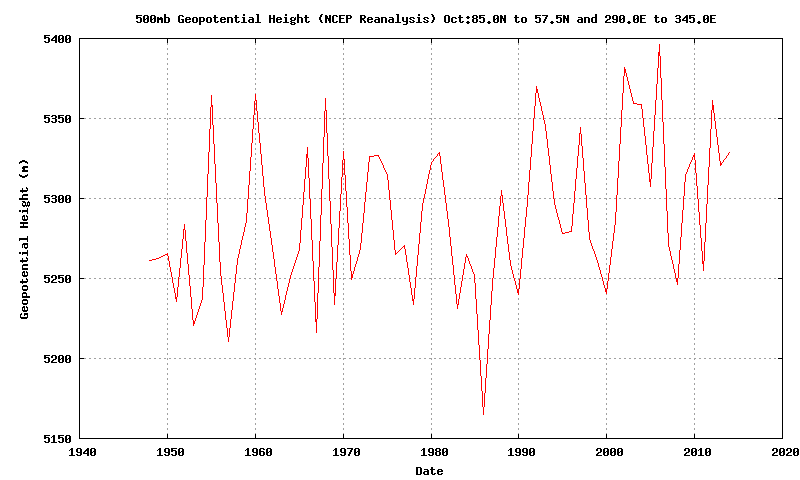
The state of the Arctic Oscillation has been a topic of significant discussion over the past several months in the meteorological community. Support for an AO in the negative state this winter is very strong. A highly anomalous pattern over Eurasia and Siberia produced volatile weather and snow extent that not only reached far beyond the extent of the past several years, through 2007, but also many years before that. The 500mb geopotential height anomalies for the month of October, below, show the pattern. Note the most anomalous feature on the globe — negative height anomalies in Eurasia.


The byproducts of this snow cover can be best described as “innumerable”. Snow cover of this extent with an anomalous pattern aloft has preceded some of the most -AO winters on record. But the persistence of the snow cover and the pattern itself supports the development of a -AO regardless of its strength.
The research regarding Eurasian snow cover in October and preceding a -AO winter was developed by Judah Cohen. He notes that both snow cover extent (SCE) and snow advance (SAI — ‘I’ for Index) strongly correlate to a -AO winter. What’s important to note is that the SAI is actually a stronger predictor on its own than the SCE.
Interestingly, there was a bit of a dropoff in snow cover during the last few days of the month. Note, however, the lighter shading of the lines each year — this actually represents the slope of the increase for the month, which denotes the SAI. Thus, despite the dropoff in coverage during the last few days of the month, the overall slope was still easily the highest its been in recent years, and the 2nd highest ever recorded. The only higher year was 1976, and the winter of 1976-1977 turned out to be one of the coldest winters on record for the United States.
The very high SAI for October is certainly a strong indicator of a strongly -AO winter. That being said, last year, the SAI was very low, as it indicated that the DJF (December, January, February) AO would be +1.8. The actual AO was only +0.18, with a predominantly -AO in January and February. Last year was a bit of an oddity, because despite the very slow snow cover advance, the October snow cover extent (SCE) was actually pretty high. This was due to a lot of snow to start the month, and then slow increases afterward. It has been theorized by some that the strong +AO predictor by the SAI was somewhat cancelled out by the strong -AO predictor of the SCE — though with the SAI being the better indicator, the overall sign of the AO was slightly positive.
Going back to this year, despite the drop in SCE during the last few days of October, we still finished with plenty of snow cover. As a whole, October had plenty of snow cover extent, which is important in generating the atmospheric feedbacks for a -AO winter. It’s not as if the atmosphere only responds to the final snow cover on October 31 — the atmospheric processes take hold during the whole month.
The fact that both the SCE and SAI were both very high in October is a strong indicator of a -AO winter, with potentially some periods of significant high-latitude blocking, like we saw in the winter of 2009-2010.
The following composite chart shows the 500mb geopotential height anomalies averaged for the 5 winters of highest preceding October Eurasian snow cover. Notably, extremely cold air makes its movement into Southern Canada and much of the Northern ⅓ of the United States while ridging builds in the high latitudes.

The negative phase of the AO produces a much more anomalous wave pattern and also moves cold air farther south into the Mid Latitudes. Below is a graphic (NOAA) showing the average mid level jet pattern during the negative phase of the Arctic Oscillation.

It does not require a significant amount of research to understand what the impact of a strongly negative or positive Arctic Oscillation could do to our areas weather. When taking the Decembers from the 3 winters of 2009, 2010 and 2011 the Arctic Oscillation featured some fairly significant variability. The hugely negative AO in December of both 2009 and 2010 was associated with very cold, stormy weather and anomalously wintry patterns. The positive AO state in 2011 was associated with a much warmer pattern and very little snow or cold.

Forecast models, even at this stage in Early November, are beginning to pick up on the drop in the Arctic Oscillation in the long term. The following ECMWF HRES Deterministic Graphic (Weatherbell) shows the drop in the AO anticipated by the middle of November.

While, obviously, variability is likely and the Arctic Oscillation won’t drop permanently and last for the entire winter, confidence is extremely high — higher than it has ever been for us prior to a winter season — that the AO will average negative in the months of December, January and February. There may, additionally, be bouts of negativity that bring the AO readings below -2 and -3 several times during the forthcoming months.
Stratospheric Warming Event
November monitoring
One of the reasons why a high SCE and SAI in October promote a -AO winter is because it significantly increases the odds of a Stratospheric Warming event.
Forecasting the stratosphere can be extremely fickle at times. But a major stratospheric warming event can often be the first signal of a pattern change, which could obviously produce varying weather conditions in our local area depending on where the stratospheric warming occurs.
Stratospheric warming events in November have often been tied to major pattern changes leading the way into the forthcoming winter. Specifically, warming in the lower stratosphere over Eurasia during the month of November can signal a pattern change and circulation progression that supports a persistent – AO and movement of cold air into the mid latitudes of North America.
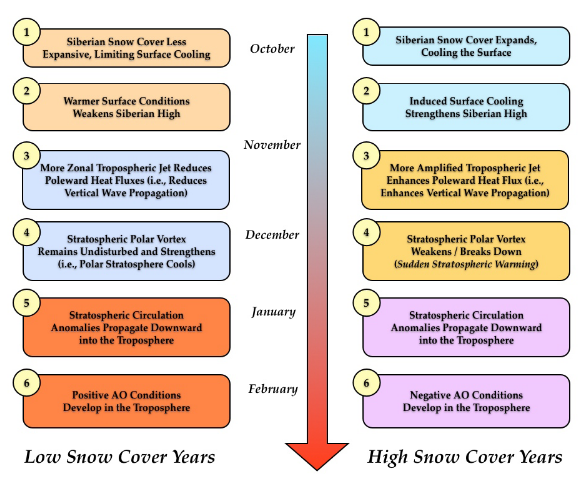
Eurasian snow cover can help induce heat flux into the lower stratosphere during the months of November — and our highly anomalous snow cover over that area this year enhances the chance of that occurring. Accordingly, medium and long range forecast models have begun to pick up on this heat flux and the lower stratosphere warming dramatically during the mid to late portion of November. The fact that this is occurring is a strong sign that the drivers for a -AO winter are starting, and the above flowchart is already taking place.

The flowchart generally indicates that the increased heat flux occurs in the first half of November, and then the Stratosphere would warm in late November and early December. However, it’s possible that the SCE and SAI were so high in October that the process began a bit earlier. If this is the case, the Stratospheric warming event could indeed be occurring in mid-to-late November, and help to induce a -AO earlier than the flowchart indicates. This, in turn, could leads to December, January, and February all having a -AO, and potentially all being colder and snowier than average. Above, the ECMWF ensemble shows the beginnings of warming in the lower stratosphere over Siberia during the middle of November.
Quasi Biennal Oscillation (QBO)
Prediction: Negative, moving toward neutral
The QBO is a quasi-periodic oscillation of the equatorial zonal winds between easterlies and westerlies in the tropical statrosphere. The mean period of the QBO is 28 to 29 months. In simpler terms, the QBO as measured is the mechanism to move warmer air in the stratosphere from the regions near the tropics to the regions nearer to the pole.
Extensive research on the state of the QBO and its relationship to high latitude blocking has raised the eyebrow of many meteorologists in the past 5-7 years. Essentially, research shows that QBO values of +10 or more, or -10 or more can provide clues as to whether or not high latitude blocking will develop in the forthcoming winter. Typically, a positive QBO tends to promote a deeper, more profound polar vortex through the stratosphere. Global circulations tend to keep this polar vortex circulation nearer to the poles. A negative QBO tends to support a more mobile polar vortex with an anomalous wave break pattern and the potential for pieces of this vortex to move farther south.
The QBO in October came in with a final number of -23.86, which is only marginally higher than the September number and a significant slowdown in QBO number drop. Why is this significant? Zonal wind anomalies show support for the QBO to rise steadily over the next several months. This brings us to some interesting analogs and comparisons.
There have been 5 autumns which featured -20 or lower QBO’s which then rose to a value near -10 by December. A small dataset, but QBO numbers for October and December, and the snowfall in the winter that follows, shows a high correlation for above normal snowfall.

A rising QBO to values near -10 by December statistically supports high latitude blocking and a -NAO average in the following winter. Dave Tolleris composed a chart (above) with analog years and QBO numbers showing the percentage chance of NAO in the winter that follows.
Nevertheless, the negative autumn QBO (Strongly so) followed by a steady rise into the early months of the winter supports not only a weaker stratospheric polar vortex, but a more mobile one in the mid levels — and the presence of high latitude blocking this winter.
Furthermore, per research by Allan Huffman, every analog year that combines a -QBO with a weak-to-moderate El Nino (which is forecast this year), had a -AO winter. This includes the winters of: 1958-1959, 1965-1966, 1968-1969, 1976-1977, 1979-1980, 1986-1987, 2002-2003, 2009-2010. Additionally, three of those winters also ranked in the top 10 in Eurasian snow cover: 1976, 2002, and 2009. The DJF AO was -2.6, -0.65, and -3.4, respectively. And even though 2002-2003’s AO was only moderately negative, it was still quite the cold and snowy winter for the Eastern US.
Every one of those winters also had a -NAO, except 1979-1980, which was barely positive (+0.1). Thus, when one adds the QBO into the equation, a very strong signal for a -NAO and -AO winter is generated, and a moderately strong signal is generated for a significantly -AO winter.
Greenland Blocking and Snowfall
Prediction: Strong correlation
Since 2002, the 500mb height anomaly in October over Greenland has given an excellent indication of not only the winter snowfall potential in the winter afterward, but the high latitude blocking when associated with the aforementioned QBO and stratospheric warming.
An average October 500mb reading of 530 in Greenland is the “dividing line” between statistically snowy winters, and statistically non-snowy winters in NYC. Readings below 530 have typically produced below normal snowfall winters, while most readings of 530 or higher featured above normal snowfall winters. This correlation has worked in 10 of the past 12 winters.

The October 2014 500mb average height in Greenland came in at 532 (thank you, bluewave, for the data). This supports a heightened likelihood of high latitude blocking and above normal snowfall in NYC during the upcoming winter.
2002 538……..49.3″…Above normal snowfall
2003 535……..42.6″…Above normal snowfall
2004 535……..41.0″…Above normal snowfall
2005 530……..40.0″…Above normal snowfall
2006 539……..12.4″…Strong February Blocking, but relationship failed
2007 527……..11.9″…Warm winter, little snow
2008 524……..27.6″…Near average snowfall
2009 531……..51.4″…Well above normal snowfall
2010 532……..61.9″…Well above normal snowfall
2011 525……..7.4″ …Warm winter, little snow
2012 536…….26.1″….Higher snow amounts east of NYC
2013 532…….57.4″
Pacific Decadal Oscillation (PDO)
Prediction: Predominantly positive
Sea surface temperature anomalies over the past 4-6 weeks have turned to a near-textbook match to a positive PDO state in the Central and Northern Pacific Ocean, but the primary PDO state has actually been positive since last January.


Since 1981, there have been several December-February periods which featured an average PDO of 1 or greater. Those years were: 2003, 1987, 1984, 1977, 1988, 1986, 1998, and 1985.
Those years featured an average 500mb height anomaly of -25 over the Eastern ⅓ of the United States. Other notable features include an Aleutian trough, and the presence of high latitude blocking or higher than normal heights at 500mb in all of those years.
Conclusions, Questions and Variables
What can go wrong
The aggregation of our research and still incoming data has led us to the following predictions and conclusions regarding the upcoming Winter of 2014-2015. The pattern and global circulation progression has also led us to the following questions and concerns.
Conclusions and Predictions:
- A high probability of a – AO throughout the winter
- A higher than normal probability of a – NAO
- A high probability of a +PDO
- A higher than normal probability of persistent high latitude blocking
- A higher than normal probability of a notable stratospheric warming event in November over Eurasia
Variables, Questions and Concerns:
- Progression and strength of El Nino over the next 4-8 weeks
- Positioning of SSTA cold pools in both the Atlantic and Pacific
- Occurrence and timing of stratospheric warming in Eurasia as a result of anomalous snow cover heat flux.
- Resulting global pattern change — and timing of pattern change as a result of multiple above listed variables.
Conclusions and Predictions
December Temperature Anomalies: 0 to -2 (Below Normal)
January Temperature Anomalies: -1 to -3 (Below Normal)
February Temperature Anomalies: -2 to -4 (Below Normal)
December Precipitation Anomalies: Above Normal
January Precipitation Anomalies: Near Normal
February Precipitation Anomalies: Near Normal
Winter Snowfall:
New York City: Above Normal
New Jersey Shore: Above Normal
Interior NJ, SE NY, CT: Above Normal
Philadelphia, Southern NJ: Above Normal
December Highlights: The volatility of the first week or two of this month will depend greatly on the stratospheric conditions in November. But the potential exists for a volatile month throughout. Above normal precipitation is anticipated with a storm track favoring re-developing Nor’Easters. Plentiful cold air to the north over Canada will support frozen precipitation, especially in the Northern ⅓ of our forecast area. The month should turn especially stormy toward the tail end.
January Highlights: The pattern may regress in terms of volatility, but will remain cold with occasional storms capable of producing widespread snow. The jet stream will dip farther south at times bringing chances for snow farther south. The effects of stratospheric warming, the -NAO, and Atlantic blocking will be felt in full.
February Highlights: High latitude blocking is expected to be in control during the early part of the month while a predominantly -AO continues to surge cold air farther south as well. This period will feature the highest likelihood of a winter storm in the Mid-Atlantic States, with the coldest temperature anomalies relative to normal. The second half of the month may feature some moderation and a regression of the winter pattern.
Overall Highlights and General Expectations: Last winter was long, cold, and snowy — one of the snowiest winters we’ve had. Although we are also forecasting a cold and snowy winter this year, it will most likely behave a bit differently from last winter.
Last winter had a high number of snowfall events, though not one true “blockbuster” in our area. This is because the pattern was dominated by the northern branch of the jet stream sending strong impulses of energy southward, as well as Polar Vortex intrusions. Since the northern branch of the jet stream was so dominant, along with the fact that we did not have an El Nino, the southern branch of the jet stream was largely absent. Many of our biggest snowstorms are fueled by Gulf of Mexico moisture, which last year was often cut off from interacting with our storm systems. This year, we are expecting more influence from the southern branch of the jet stream, yet still some influence from northern branch of the jet stream as well– at times it will be a classic “split-flow” pattern (El Nino winters tend to increase the southern jet stream). Although this El Nino event is only a weak one, there are already signs that the atmosphere is taking on El Nino-like effects, such as a strong Aleutian low and a split-flow to the jet stream.
Additionally, since the El Nino is only a weak one, the northern branch of the jet stream will still be able to have an influence on our pattern — especially if we get significant blocking to force pieces of the Polar Vortex southward. This leads to a much higher likelihood than last winter of a major snowstorm, because there is the chance of impulses and moisture from the southern branch of the jet stream/Gulf of Mexico to phase and interact with strong pieces of energy from the northern branch of the jet stream — when this is combined with high-latitude blocking, major snowstorms could develop along the East Coast. When the pieces of energy are not phasing, weak El Nino winters can still provide a variety of types of winter storms — as there will be times when the northern jet stream dominates more (Miller B storms) as well as the southern jet stream (Miller A), or even hybrids. This is why weak to moderate El Ninos are often (but not always) much snowier than average, as there are many more ways a snowstorm can likely be generated. Overall, there will probably be fewer snowstorms in quantity than last winter, but more bigger snow events.
As far as the cold is concerned, last winter had a slightly mild December, but a very cold January, February, and March. It is unlikely that this winter will feature that same three-month period of significant cold. This is because we may not see the same amount of -EPO ridging as we saw last winter. That being said, it is possible that all of the winter months will be moderately to at times significantly below average in temperature, as well as above average in snow, so it may still feel like a long winter.
Trackbacks & Pingbacks
2locomotion
[…] Cidade de Nova Iorque no inverno (foto via) […]
Comments are closed.