-2")
Was the NAM’s blizzard forecast really that good?
Oh, the NAM. The source of so many colorful snowfall projections that spread like wildfire across social media. The weather model that gives meteorologists fits multiple times per season. The weather model that can pick out thunderstorms two days in advance, and completely mishandle a snowstorm at a 24 hour lead time. And now, the weather model that absolutely nailed the forecast for the Blizzard of 2016 in New York City.
The Blizzard of 2016 will likely go down as one of the most effectively modeled snowstorms in meteorological history. The signal for the storm system was evident as far as 8 days in advance (arguably longer via long range pattern recognition). Long range ensemble guidance and even individual operational model runs showed the storm systems evolution consistently 6 to 8 days in advance, with increasing agreement on a major low pressure system off the East Coast. And, up until Day 5 or so, the agreement was relatively unanimous among major global models such as the GFS, Euro and Canadian.
All of that changed when the storm was 3 or 4 days away. The GFS and Euro began waffling on exactly how the storm would play out. The evolution changed on these forecast models, especially in the mid and upper levels of the atmosphere. Suddenly, the Euro was “cutting off” the mid level trough over the Plains and Mississippi River Valley, meaning the surface low would track off the coast of the Carolinas and never make it here.
The GFS trended southward by the time the storm was 3 to 4 days out, as well. The Canadian started heading that way, too. All global models increased confluence to the north (reaffirming high pressure) and trended toward cutting off the storm system earlier. Suddenly, it seemed like the southerly solution was gaining traction, and the low pressure center wouldn’t make it to a far enough north latitude to impact our area.
And then came the NAM. The storm system finally appeared within the NAM’s window when it was 78-84 hours away.
From the get-go, the NAM had the storm system more amplified than globals had shown for days. The low pressure center emerged from the Southeast Coast, with tremendous atmospheric dynamics guiding the storm northward to a position off the Mid-Atlantic Coast. Incredible dynamics moved toward the New York City area, with near two feet of snow on the groundby the time the storm ended.
It couldn’t be right. Could it?
As the days passed by, the NAM never wavered. Precipitation amounts fluctuated, and banding location varied slightly, but while other global models were largely showing a miss — and trending worse — the NAM maintained that the storm would heavily impact our area. A day or so before the storms approach, it became clear the NAM was on to something. And it was.
We re-ran these NAM runs on our model server to visualize the output.
The NAM run from 12z, Friday January 22nd shows it absolutely nailing the placement of the banding. Analysis shows that other NAM runs at larger lead times also nailed this banding, as well as the placement of the surface low.

The NAM run from 12z Thursday, January 21st (valid for the same time as the other image) also correctly predicted the heavy banding that would hit the NYC area and points westward. This was at a leadtime when many of our “best” models were still out to sea.
The NAM run from 12z Wednesday January 20th also shows a very heavy band of snow — and this was at the end of its range! Once the storm got into its range, the NAM never wavered and was nearly identical with SLP placement and banding every run.
The NAM model run from 12z Thursday, January 21st shows the 500mb trough remaining open until the Ohio Valley, while other models had already cut it off much further SW. This was a big reason why the NAM successfully handled the positive vorticity advection and thus tucked in the surface low towards the coast on every single one of its outputs.
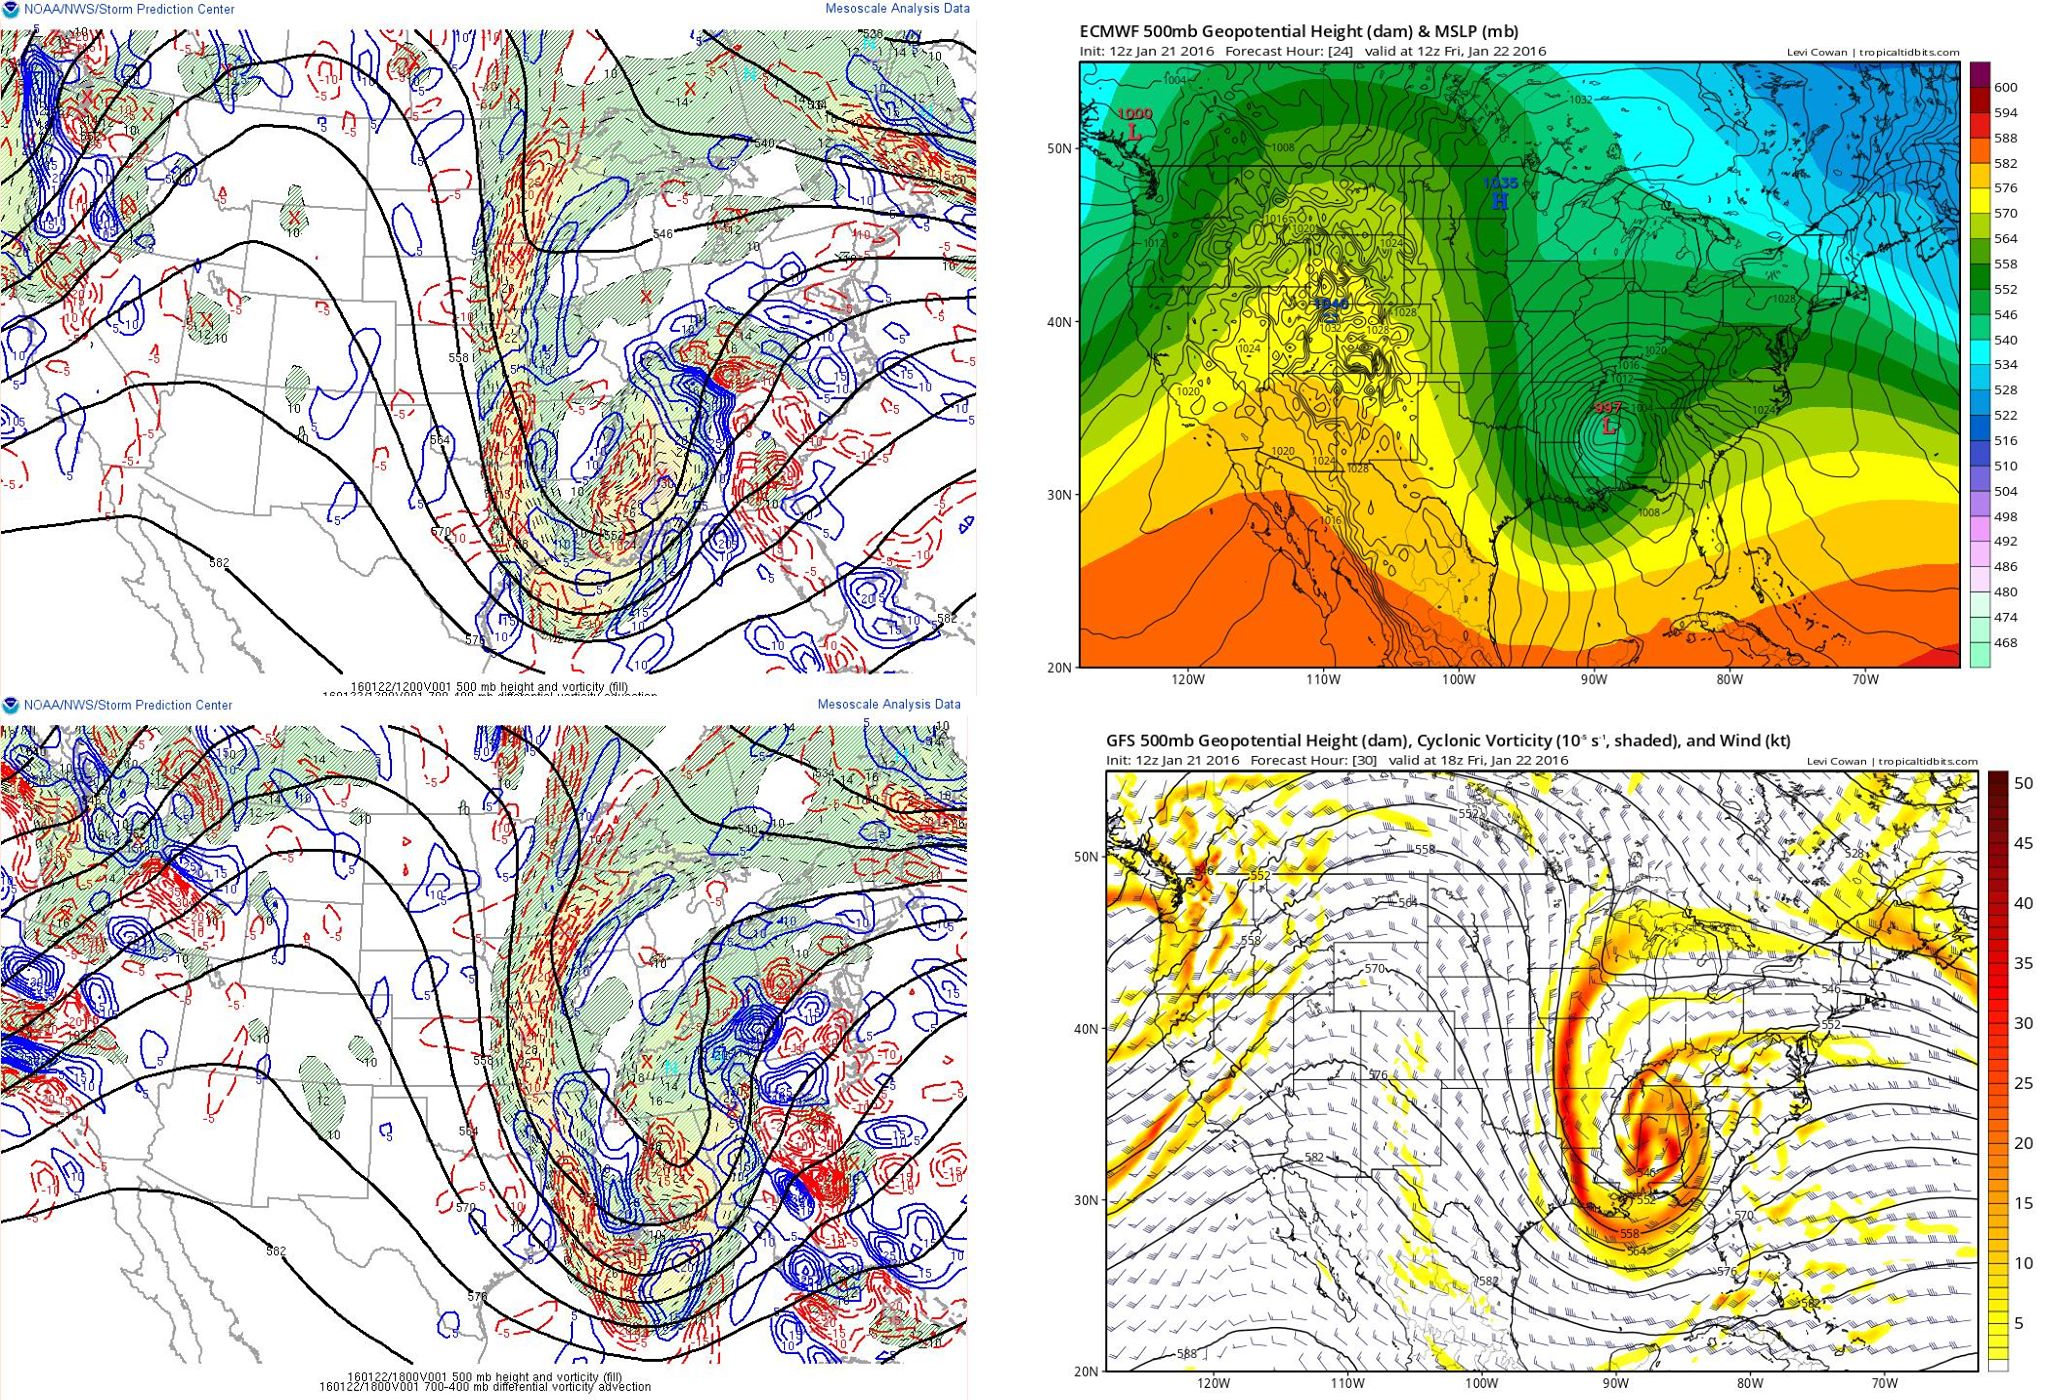
The GFS and the European Model from 12z Thursday January 21st, in comparison with actual observations. Both the GFS and the Euro cut off the 500mb low way too early, and also were showing way too much confluence to the northeast. This led them to show much lower heights (less amplification) in the East compared to the actual observations. Images courtesy of Tropical Tidbits and the SPC Mesoanalysis page.
It wasn’t just the precipitation and banding in the NYC area that the NAM correctly predicted — it also was excellent in predicting the storm’s evolution both aloft and at the surface, with both the large-scale features and the small-scale details. Not only that, but it had these correct features on every single one of its model runs, while other guidance — including the mightily-touted European model — was much too suppressed.
In all honesty, the NAM’s performance leading up to the Blizzard of 2016 may be one of the better computer modeling performances we have ever seen — especially coming from a model with a mantra of being unreliable. But when analyzing how the storm behaved, perhaps it wasn’t so shocking that the NAM got it right after all. More than likely, we need to improve our skill in utilizing it correctly.
This article was written and edited by John Homenuk, Doug Simonian, and Miguel Pierre.