-2")
Winter Outlook 2012-13
Introduction/Methodology:
Last winter featured a highly dominant pattern of lower pressures in the Arctic and higher pressures in the mid-latitudes, especially the United States. This was a classic +AO/NAO regime in which the strong jet stream precluded the amplification of cold troughs into any part of the US. As a result, the November-April period of 2011-12 was one of the warmest and least snowy on record for the lower 48 States. This winter, since the outlook is being issued a month later than last year, I hope to avoid unforeseen patterns with November’s data helping to strengthen statistical and physical correlation for the December-January-February (DJF) meteorological winter season. Factors that will be considered, but not limited to: ENSO, PDO, PNA, NAO, AO, EPO, Solar activity / trends, Stratospheric activity / trends, QBO, forecast modeling, pattern persistence and analogs (years with patterns similar to the present, rolled forward into the future to aid in long term projections). Keep in mind that we are still in the “pioneering” phase with some aspects of long range forecasting, and thus, one cannot attribute the same expectations as one would for a short or medium range forecast (1 month or less). Furthermore, do not expect the level of detail that is provided in short or medium forecasts to appear in long range outlooks. The hope is that the data we collect from the autumn season will aid in forming a general picture of the temperature and precipitation patterns of the future. These data take the form of numerous statistical correlations concerning teleconnection indices, as well as perceived physical forcing mechanisms in both the atmosphere and stratosphere.
Pacific Signaling
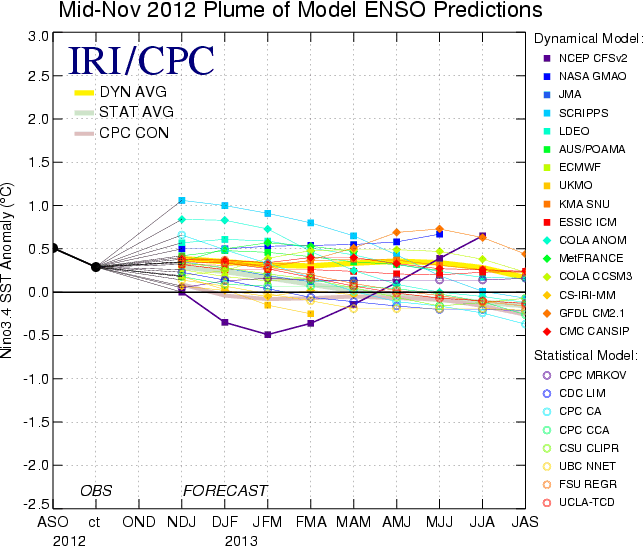
The El Nino Southern Oscillation (ENSO) index should be in a predominately warm-neutral phase for this winter season, meaning, region 3.4 sea surface temperature anomalies (SSTA) in the central tropical pacific will be in the 0.0c to +0.5c range.
Support for this includes predominately positive SOI values, indicative of a tropical Pacific pressure pattern that does not favor the eastward propagation of warmer water. Easterly tropical trades will continue in the tropical Pacific as regions 1-2 continue to run near neutral. Some of this cooler water could move westward, but the central ENSO regions should remain warm-neutral for the winter season.
Forecast guidance, including statistical/dynamical models as well as ECMWF models support the idea of a region 3.4 trimonthly peak around +0.4c.
The Pacific Decadal Oscillation (PDO) is a measure of SSTA to the north of the tropics in the Pacific Ocean. A positive PDO generally means warmer water in the Gulf of Alaska, southward along the Western US coast, while a negative PDO indicates the presence of colder than normal waters in that same region. The PDO has been strongly negative this fall, although we saw a relaxation in October. Over the past few weeks, waters have cooled somewhat again, and thus PDO values should be around -1 or more negative heading into December. Statistics suggest that most autumns with strongly negative PDO’s have at least a moderate negative PDO for the DJF season.
Thus, I have high confidence that the PDO will be negative, and ENSO will be warm neutral the next few months.
The Pacific North American Index (PNA) is highly correlated to PDO values, though it can veer off sometimes. Usually when the PDO is negative, the PNA is negative, and vice versa. A –PNA pattern favors Western US cold, while a +PNA favors Eastern cold, though other indices can mute or bolster the PNA signaling.
My research on the PNA is as follows:
PNA correlation – November to DJF: 39/61 or 64% of years in the 1950-2011 period in which the PNA modality in November was the same as DJF
DIDN’T WORK – 51/52, 54/55, 56/57, 58/59, 60/61, 63/64, 68/69, 77/78, 81/82, 82/83, 84/85, 85/86, 86/87, 88/89, 90/91, 92/93, 94/95, 95/96, 03/04, 05/06, 06/07, 08/09
PNA correlation – Dec to DJF: 49/61 or 79% of years featured the same PNA modality in December as DJF
Didn’t work – 53-54, 57-58, 58-59, 66-67, 73-74, 75-76, 77-78, 80-81, 83-84, 88-89, 90-91, 93-94
In other words – there is a strong positive correlation from Nov to DJF and (stronger) Dec to DJF. If the PNA is negative in November, there’s a tendency for a negative PNA winter, and vice versa. If the PNA is negative in December, there’s a very strong likelihood the DJF PNA will average negative.
PDO to PNA correlation: 1950-2011 analysis period
DJF with < -1.0 PDO correlated to PNA DJF Didn’t work: 90-91, 99-00, 11-12
Years with < -1.0 PDO: 50-51, 51-52, 53-54, 55-56, 56-57, 61-62, 64-65, 68-69, 70-71, 71-72, 73-74, 75-76, 90-91, 99-00, 08-09, 10-11, 11-12
14/17 or 82% correlation: When PDO is -1.0 or lower for DJF, PNA will be negative 82% of times.
Given the progression of this fall PDO wise, there’s a strong chance that the PDO will be moderately negative for the winter, and thus, a very good chance the PNA will average negative. With that being said, I think the PNA will only be slightly negative, and periods of positive PNA (strong Western ridging) should occur, given other factors I’ll explain next.
The East Pacific Oscillation (EPO) is a good indicator for height anomalies in the Gulf of Alaska/Alaska/Western Canada/Aleutians region. This part of the world is often very important for Northeastern weather, given we’re located downstream of the north pacific. Positive EPO will strengthen the Pacific jet, flooding the nation with warmth, while a negative EPO promotes high latitude blocking, often teaming up with a negative AO/NAO, and dumping big cold into the US.
My research on the EPO is as follows, for November-DJF correlation.
EPO positive Correlation: Nov to DJF (+ Nov to +DJF and vice versa)
Didn’t work: 56-57, 61-62, 62-63, 65-66, 66-67, 69-70, 81-82, 82-83, 86-87, 94-95, 04-05, 07-08, 10-11
48/61 or 79% of years featured the same DJF EPO modality as November (Nov predicted DJF 79% of the time).
This is a very strong correlation. The EPO has been negative for this particular November, and so the EPO is probably going to be negative for DJF winter season as well. Higher than normal heights should be found in the Alaskan/Aleutian area for the winter season.
Arctic/Atlantic signaling
The North Atlantic Oscillation (NAO) and Arctic Oscillation (AO) have been the much talked about indices these days, even mentioned in the media, as factors inducing the landfall of Hurricane Sandy in NJ, the historic October snowstorm of 2011, and the historic November snowstorm of 2012 in NJ/Southern New England. The fact of the matter is – blocking has been impressive this fall, and lo and behold, November does offer a strong positive correlation with respect to NAO/AO modality for the DJF season. As we’ve seen thus far, pattern persistence indicates through the statistical data that the atmospheric regime of November has a good chance of repeating for the DJF period.
My NAO research is as follows for the 1950-2011 period:
41/61 = 67.2%: YEARS HAD THE SAME NAO MODALITY IN NOVEMBER AS THE ENSUING WINTER DJF.
For the AO, period 1950-2011, we find the same correlation:
AO CORRELATION – 41/61 (67%) YEARS HAD THE SAME AO MODALITY IN NOVEMBER AS THE ENSUING WINTER DJF.
When we look at the NAO/AO values in December, we find:
DEC NAO modality predicts DJF NAO 54/61 or 89% of the time.
DEC AO modality predicts DJF AO 52/61 or 85% of the time.
In other words – if November brings some doubt, look to December.
For this year, we’ll see a negative AO and NAO for the month of November, and forecast modeling for the first half of December indicates that we’ll most likely see a negative AO and NAO. As seen with the high positive correlations noted above, a negative NAO/AO at this time of year suggested, strongly so, that the winter DJF will average a negative NAO/AO. This is not to say we will be free of +NAO/AO periods – I do expect those. However, the negative NAO/AO will be dominant.
The Quasi-Biennial Oscillation (QBO) is a measure of upper stratospheric wind anomalies above the tropics. A negative phase (easterly) has shown to promote a tendency for more high latitude blocking (i.e. negative AO) while the positive (westerly) phase tends to favor less blocking.
The QBO continues strongly negative, although rising, will average negative for DJF. This is another factor in the camp of potentially increased blocking this winter, and certainly far more blocking than last winter.
The QBO is also connected with stratospheric warming events, which we often discuss in the winter season. A stratospheric warming can signal a negative AO/NAO several weeks ahead of time (not always). However, there is a tendency for stratospheric warming events to propagate downward through the troposphere, disturbing the arctic vortex, causing a blocky pattern to initiate.
A negative QBO like we have this year often favors stratospheric warming in the December-early Jan period, while in a positive QBO, the stratospheric warming events tend to cluster about a month later, from early Jan to early Feb. On the ground, this means that negative QBO winters like this one, often have more wintry December/January periods, though this is not always the case. Like everything else, it’s a correlation, not a guarantee.
Examples of stratospheric warming events, their timing, and the resultant negative AO periods are as follows:
70mb warming in mid Jan, by Feb 20, very neg AO, lasted until Mar 25 1981, +QBO
70mb warming Jan 1 1983, neg AO Feb1-Feb 28 1983, +QBO
70mb warming early Feb 1984, neg AO March 1st-April 20th , -QBO
70mb warming early dec 1984, neg AO Dec 28-Feb 20 1985, -QBO
70mb warming early jan 1986, neg AO Feb 5-April 5, -QBO
70mb warming early nov 1996, neg AO Nov 25-Jan 15, -QBO
70mb warming mid dec 1997, neg AO jan 8-feb 15, -QBO
70mb warming mid dec 2003, neg AO jan 7-Feb 28, -QBO
70mb warming jan 2007, neg AO Feb 1-Mar 1 2007, +QBO
70mb warming early nov 2009, neg NAO Dec 1-Jan 15, -QBO
70mb warming early jan 2010, neg AO Feb/Mar 2010, -QBO
The point in all of this – winters with negative QBO’s like this one feature an increased tendency for blocking, and often times it gets going earlier. This seems to be the case now, as the negative NAO/AO are already in place, and expected to deepen into a more negative state for December.
The October Eurasian snow cover correlation has been discussed by many, and is certainly another factor in the camp of more blocking this winter.
What can go wrong?
1952-53 was a year that I pondered over for awhile, as it had a negative NAO/AO winter, even a positive PNA, but the United States saw a blowtorch winter. Why?
The EPO referenced earlier was positive during this winter, as one can see by the deep purple/blue colors south of Alaska in this map:
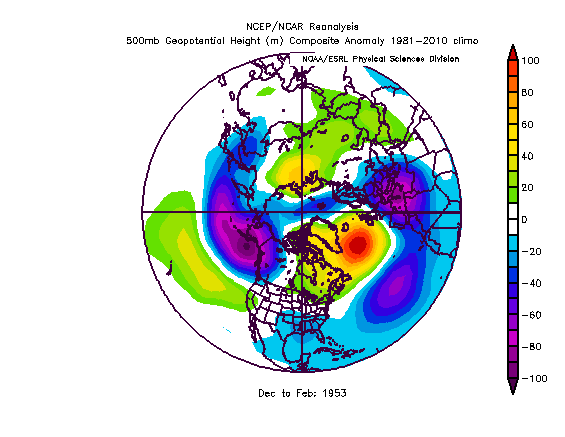
The Pacific jet was strong, and the blocking didn’t matter, as mild air flood the nation from west to east. If we see a pattern similar to this on models – sound the alarm bells. However, the EPO in November 1952 was positive, which correlated nicely to the positive EPO winter. The EPO this November was negative, which should mean a negative EPO winter.
Analogs:
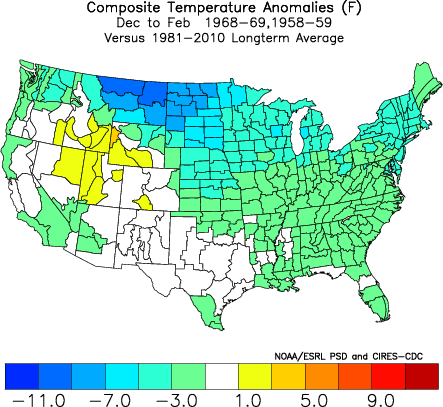
The two closest analogs I could find in terms of most of the factors explained are 1958-59 and 1968-69. Not everything is the same, but quite a bit of similarities.
Those winters were very cold ones across most of the USA, with some warmth in the West.
Another factor not mentioned yet – global atmospheric angular momentum (GLAAM) has surged positive in recent weeks. Since 1950, a negative GLAAM has correlated to more Nina like atmospheric regimes while positive GLAAM has correlated to more Nino like atmospheric regimes. Additionally, winters with a +GLAAM tended to have more moisture, including 57-58, 60-61, 63-64, 66-67, 76-77, 77-78, 86-87, 95-96, 02-03, 04-05, and 09-10, while winters with –GLAAM tended to have less moisture, and thus less snowfall, in the Northeast corridor, like 61-62, 62-63, 64-65, 67-68, 58-59, etc. Virtually all of the years noted were cold ones in the Northeast, but the snowfall was more variable (some snowy some not so snowy). Given the recent surge in GLAAM values, there is reason to believe the pattern of coastal storms we’ve seen in November could very well occur in the ensuing cold season. I am not expecting a blockbuster snow year in the Northeast corridor, but it is likely that normal values will be reached, and very possible that above normal snowfall will occur.
Weather Summary for DJF:
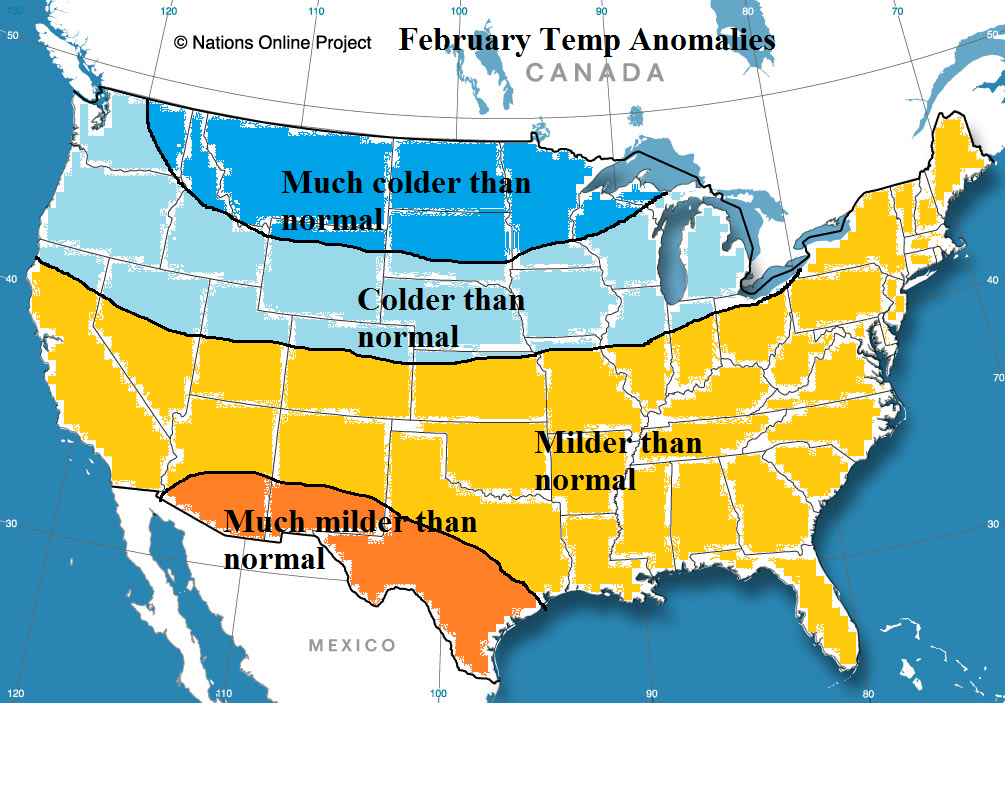
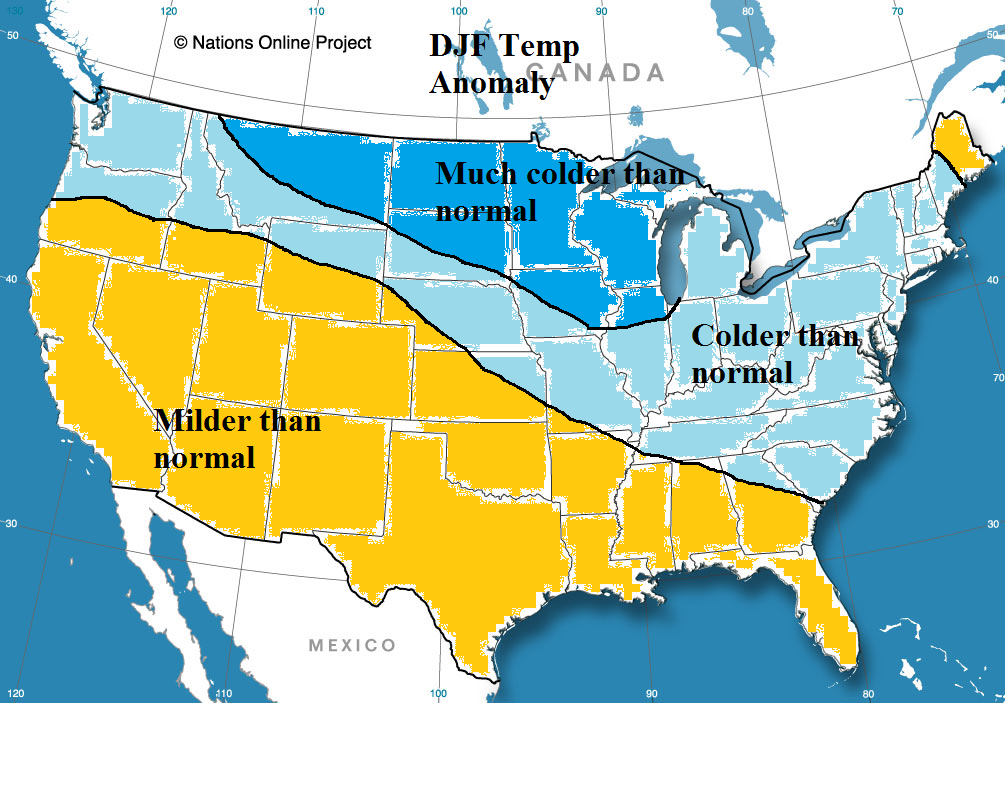
December should start warmer than normal across much of the USA as ridging expands from west to east. The NAO and AO will become increasingly negative in early December, although a brief burst of positive of EPO will yield a warmer than normal temp regime for the Eastern US. However, by the second week of December, Alaskan ridging and polar blocking should result in a re-shuffling in the global regime, and the mean trough should position itself in the Mid-west and Northeast US. The month overall will be much colder than normal in the northern plains and colder than normal in the Northeast, as weeks 2-4 outweigh the warmth of weeks 1-2 in the Northeast. A stratospheric warming event may develop in mid December, leading to maintenance of blocking during the month of January. In fact, I expect Dec-Jan to produce the bulk of the cold temp anomalies in the Northeast. February, the negative NAO/AO may neutralize with a more Nina-like pattern developing, as colder than normal temps dominate the PAC NW and Plains, with near to slightly above normal temps on the East Coast. This is not a classic El Nino temp pattern. ENSO will be weakening by later winter, and given my expectations with NAO/AO and blocking timing, the Dec/Jan period should be colder than February, although I don’t believe February will torch. Overall, a very cold winter is on tap for much of the northern tier of the USA, down to the SE US coast. The SW US and southern Plains should be mild. Precipitation should increase compared to November’s precip anomalies, but I expect a below avg precip winter in the Northeast. However, there will be bursts of increased Sub tropical energy, resulting in several coastal storm opportunities. I anticipate below normal snowfall in Northern New England, with their snowiest month being February (the mildest month wrt normal) and near or above normal snowfall for Southern half of New England and the mid atlantic.
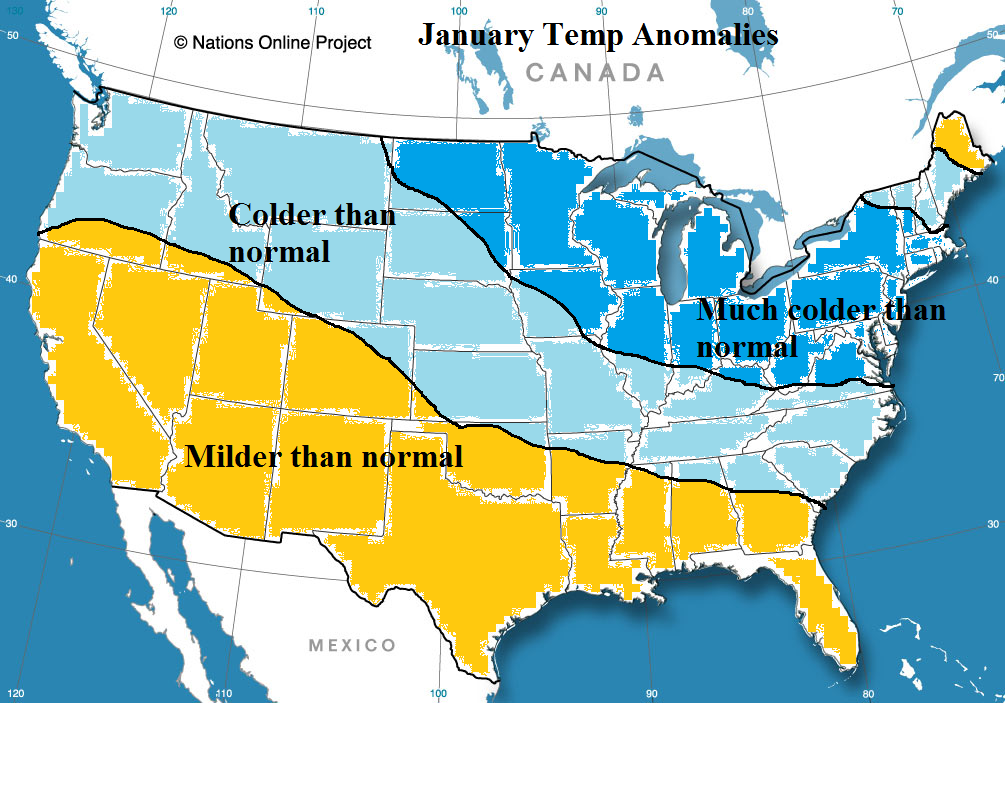
Forecast temp departures for NYC (Central Park)
December: -1 to -2
January: -3 to -4
February: 0 to +1
DJF temp departures: -1 to -2
Snowfall: Near to Above Normal
Leave a Reply
Want to join the discussion?Feel free to contribute!