-2")
What causes storms to strengthen?
In light of Wednesday’s meteorological bomb of a storm that was just offshore, we have decided to write an article that explains why storms strengthen to begin with, and how they can get to be as strong as this storm got. Wednesday’s storm went under what we call “bombogenesis” (yes, that is a real meteorological term), meaning that its pressures dropped more than 24 millibars in 24 hours. At once point, surface analysis showed the storm being as strong as 955mb, which is equivalent to a category 3 hurricane!
As most of you probably know, a lower pressure means a stronger storm, and a higher pressure means a weaker storm — or if the pressure is high enough, an area of tranquil weather. Now the question becomes, what causes pressures to fall in a certain area, and why do they sometimes fall so rapidly?
The most important meteorological aspect for pressure falls is an area of upward vertical motion. If air is being lifted vertically, then pressure within that column of air has to decrease, because air is escaping that column when it is moving vertically. Naturally, if less air exists within a column, the pressure in that column will be less.
The atmosphere always wants to maintain balance, so to accommodate for the air that is being lifted vertically, there is a need for air to converge at the surface to replace what is lost at the surface, and to generate the lift to fill the void in that column of air as well. This is one reason why air converges at the surface in areas of lower pressures; it is all part of the balancing act of the atmosphere. Air also flows from higher pressures to lower pressures, being that lower pressures are an area of least resistance; another aspect of this balancing act. All areas of relatively higher pressures essentially shove air away, and it all converges where the lowest pressure is. This surface convergence leads to upward vertical motion, which leads to storm development, precipitation, and an additional lowering of pressure.
To illustrate this further, think about the opposite scenario: wouldn’t it make sense for pressure at the surface to be higher if there were downward vertical motion, meaning that air is being pressed downward towards the ground?
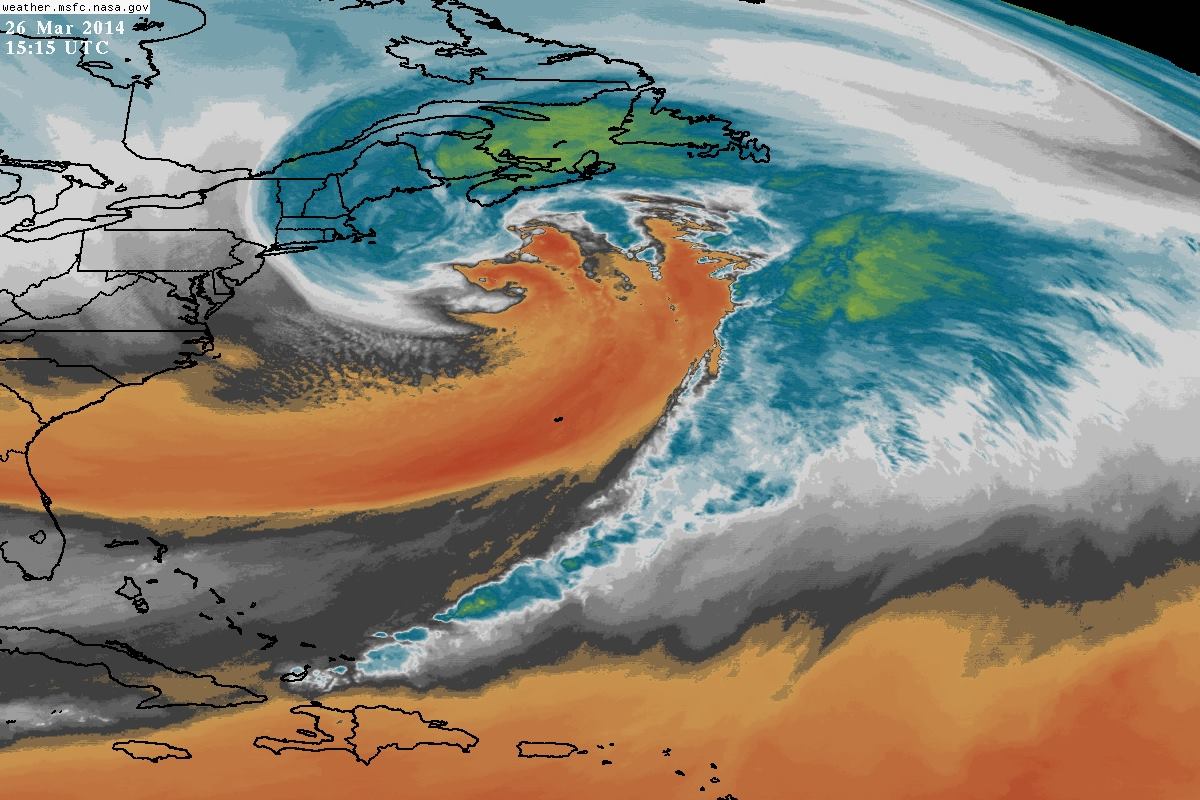
A water vapor animation taken Wednesday afternoon, beautifully illustrates the size and strength of the storm system (wx.rutgers.edu). You may need to click to animate.
Let’s go over the factors that cause upward vertical motion:
1) Divergence aloft.
Divergence aloft in meteorology is when air is separating — it’s heading in opposite directions. The atmosphere will always have a tendency to balance itself out. Thus, when air is separating aloft, there is a need to replace that separating air. This is when upward vertical motion comes in — beneath the separating air aloft, air must be rising vertically to replace that separating air, and reinforce it. It cannot be reinforced by sinking air above it, because once we are very high in altitude, we approach the stratosphere, where atmospheric motions are much weaker, and any movement of air would not be nearly enough to keep the atmosphere in balance — we need the strong motions from our atmosphere (troposphere) to keep everything in balance when air is diverging aloft.
Once the upward vertical motion is finally able to sufficiently spread out aloft, that means that the amount of air in that column can really start to decrease, since that is when it is leaving that vertical column.
Now that we know that divergence aloft leads to upward vertical motions from below, and that upward vertical motion leads to lowering pressures, it is now prudent to identify what causes divergence aloft.
This is where it is very important to look at jet streaks in the atmosphere — or localized areas where the jet stream is the strongest. It has been deduced that areas located in the right entrance (right side of where a jet streak begins) and the left exit (left side of where a jet streak ends) lead to upward vertical motion. If we take a look at Wednesday’s jet stream pattern, it becomes very clear why there was so much upward vertical motion.
The jet stream pattern Wednesday afternoon shows that our storm was located in an area that had two left exit and one right entrance region all juxtaposed. This leads to lots of upward vertical motion and pressure falls (NCEP).
Our storm was located just offshore of Cape Cod during late Wednesday morning and early afternoon. At that time, there was a powerful curved jet streak to the east of the storm, and our storm was in the left exit region of that jet streak. Additionally, there was an additional jet streak on the downstream side of the ridge in the Plains, of which our storm also in the left exit region. To the north, there was another strong jet streak due to confluent flow to the north, of which our storm was in the right entrance region.
Why is it these locations of the jet streak that produce upward vertical motion? I’ll try not to get too technical, but one explanation has to do with vorticity, or counterclockwise spin in the atmosphere. Intuitively, stronger vorticity can often mean stronger storms, because areas of low pressure have a counterclockwise flow (in the Northern Hemisphere). When looking at a jet streak, a vorticity maximum is usually located directly on the cold side of the center of the jet streak (north in a west-to-east jet streak, and west in a south-to-north jet streak). This is because on the cold side of the jet streak, as the air tries to flow counterclockwise, it does not run into any resistance. On the cold side of the jet streak, the initial counterclockwise motion runs away from the jet streak, which means the winds are getting weaker — this allows for the counterclockwise motion to be completed all the way through. However, on the warm side of the jet streak, the initial counterclockwise motion runs right into the heart of the jet streak and it thus gets sheared out in the direction of the jet streak, as opposed to being able to rotate counterclockwise. This means that we have a vorticity maximum on the cold side of the jet streak, and a vorticity minimum on the warm side of the jet streak.
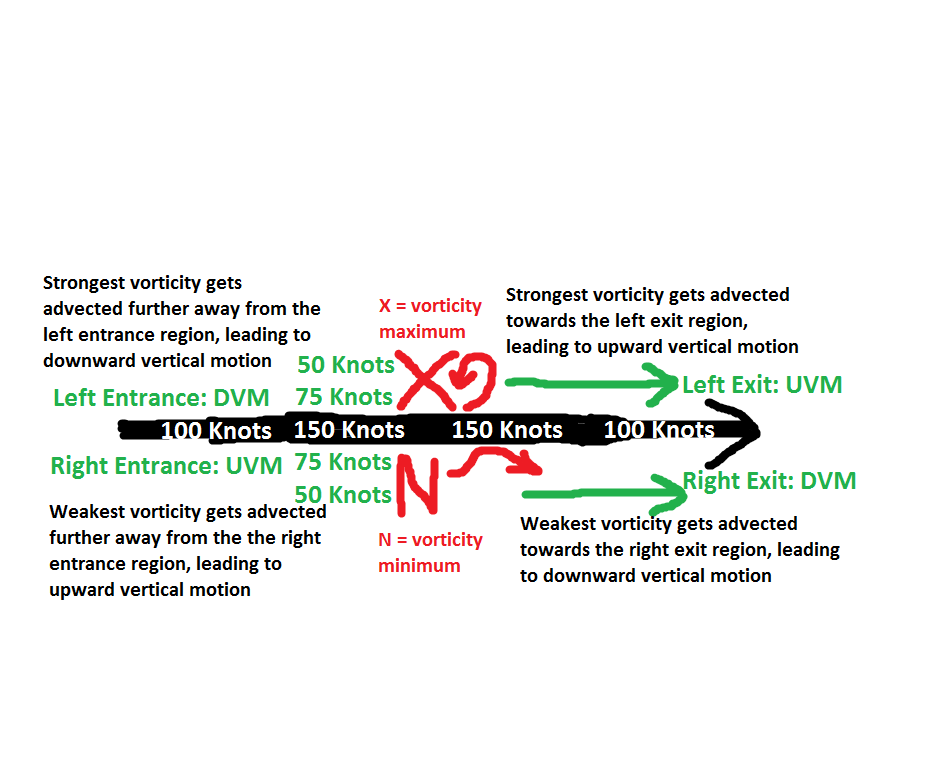
An idealized diagram illustrating vorticity advection and a jet streak in the upper levels of the atmosphere, and associated vertical motions in the atmosphere.
Thus, the strong jet streak will be advecting the area strongest vorticity on the left exit side. However, on the right exit side, the weakest vorticity is getting advected. This is why we have upward vertical motion on the left exit side, yet downward vertical motion on the right side. Of course, the explanation behind why positive vorticity advection leads to upward vertical motion is a bit more complicated than the initial intuition that vorticity leads to more counterclockwise spin in the atmosphere, which is associated with lower pressures. Positive vorticity advection causes divergence aloft, which was the whole start of this section to begin with.
When vorticity is being advected into a region where the jet streak is weaker, the atmospheric motions — including the ones that are turning counterclockwise to begin with — get a little weaker as well. Thus, the atmosphere’s vorticity surrounding the vorticity maximum is also a bit weaker. As we said before, the atmosphere always has a tendency to balance itself out, which means that in order to accommodate for surrounding weaker vorticity, the vorticity maximum needs to somehow lose some of its vorticity. It does this by spreading out, or diverging, which explains the upper level divergence. An analogy for this is a figure skater: if they spread their arms out, their spinning slows down — if air diverges, its counterclockwise spinning, or vorticity, slows down.
A 500mb and vorticity image taken on Wednesday afternoon (3 hours after the jet streak image). Notice how the strongest vorticity and core of the storm is now located where the left exit region of the curved jet was previously located (as well as the right entrance region of the jet to the north). This means the strongest vorticity got advected into the exact region it should be advected into if you want explosive storm development (NCEP).
Of course, as the jet streak propagates with the vorticity maximum, any weakening is halted as the stronger atmospheric motions catch up. However, it is the initial balancing act the atmosphere does when strong vorticity is advected into a weaker vorticity environment that causes the upper level divergence, and thus the upward vertical motion, to begin with. This causes pressure falls.
There is even more to the explanation than just this — it is actually differential vorticity advection, meaning vorticity increasing with height (which is generally true considering how atmospheric flow increases with height) that is associated with the upward and downward vertical motions with the atmosphere; but in order to prevent this from turning into a college course, we will move onto the next factor.
2) A strong temperature gradient.
As some of you know, storm systems tend to form along frontal boundaries, where warm air and cold air are clashing. Once again, this goes back to the atmosphere wanting to balance itself out. The Poles are quite cold, and the Equator is quite warm, which gives the atmosphere a tendency to want to push the warm air towards the Poles, and cold air towards the Equator. If an extremely cold airmass is located very close to an extremely warm airmass, then you have lots of warm air rushing poleward right next to a location where lots of cold air is rushing equatorward. Over time, this can create counterclockwise, or cyclonic flow in the atmosphere.
Initially, we might have a scenario that looks like this:
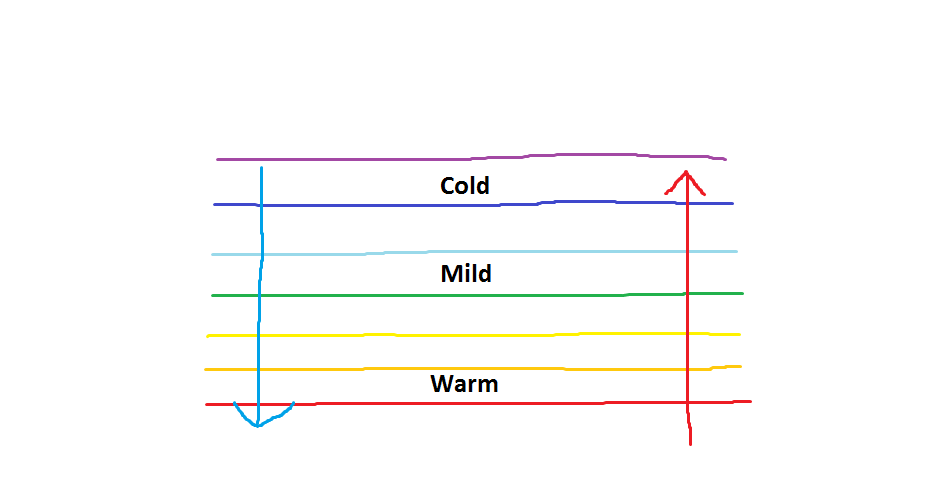
Idealized scenario where cold air and warm air are located very close to one-another. The atmosphere tries to balance this by pushing warm air towards the cold air, and cold air towards the warm air.
The isotherms are initially purely west-to-east, and the warm air is rushing northward, and the cold air is rushing southward. This means we have a northerly flow to the west and a southerly flow to the east. This will eventually change the orientation of the isotherms with time.
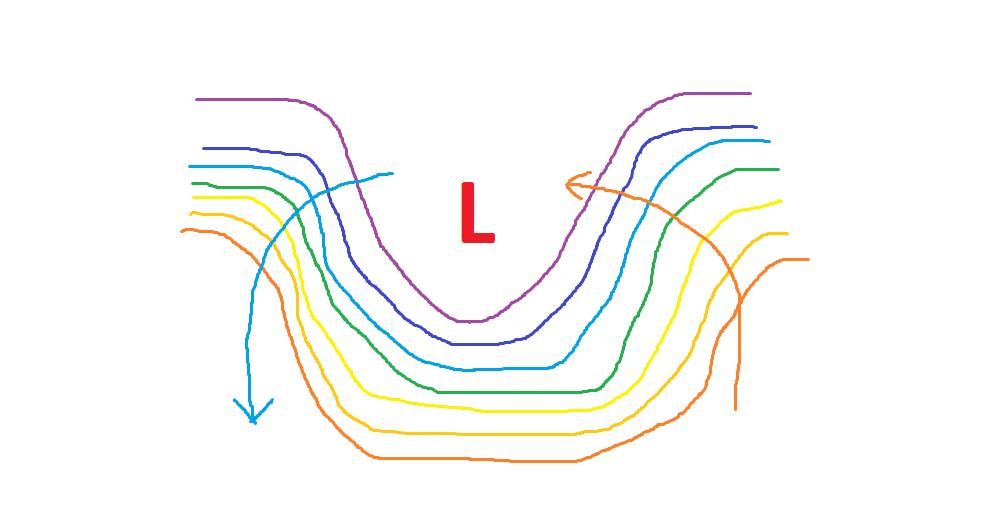
Over time, a ridge of warm air will form to the east, and a trough of colder air will form to its west. This creates a temperature gradient not only in the north-to-south direction, but also in the west-to-east direction. This helps create cyclonic motion in the atmosphere.
Eventually, when enough warm air is getting pushed northward, and enough cold air is getting pushed southward, ridges of warm air and troughs of cold air can develop — this is part of the process behind our standard ridges and troughs. This allows temperature gradients to also form in the west-to-east direction as opposed to just the north-to-south direction. Thus, air will also flow in these directions to balance out the atmosphere, contributing to counterclockwise motion.
It is often not just the strong temperature gradients that create this counterclockwise motion, but it contributes to it. The ideal scenario for a strengthening storm is an area of vorticity that has already formed — perhaps maybe in the form of a shortwave trough — moving into an area that has a strong temperature gradient. That way, the area of vorticity can strongly be enhanced, which can help contribute to enough vorticity advection for upward vertical motion. If this is juxtaposed in an area with a very strong jet streak, explosive storm development can occur.
Storms develop along frontal boundaries, so it also makes sense that the stronger the temperature gradients, the stronger the fronts, and the stronger the storms.
A diagram showing a Low Pressure system and its associated cold and warm fronts (NOAA).
Not too dissimilar from the previous diagram, we see that warm, moist air is out ahead of the low pressure and its associated cold front, cool air is located to the north of the warm front, and much colder, drier air is located behind the cold front. The stronger these gradients are, the stronger the tendency will be for the atmosphere to need to balance itself out by blowing warm air towards cold air, and vice versa — thus frontal boundaries and storms. As a storm deepens and matures, its winds strengthen, and thus the ability to advect warm and cold air increases — strong warm air advection is also another trigger for lift and precipitation.
Over time, however, the cold front catches up to the warm front, leading to an occluded front. This is because cold, dry air is very dense, so the cold front gets a large “push” from that dense airmass. Additionally, the warm moist air out ahead of it is not dense at all, so the cold front has little resistance. The warm front moves slowly for the opposite reasons — it has a weak “push” from a lighter, warm airmass, and it’s attempting to push into a more dense airmass, leading to resistance.
The occluded front causes weakening because now we have cold air overtaking the warm air, which reduces the temperature gradient. Right when the occluded front begins to form is when the storm is mature, since this is when the initial gradients and “pushes” were maximized. Afterward, the storm slowly begins to weaken.
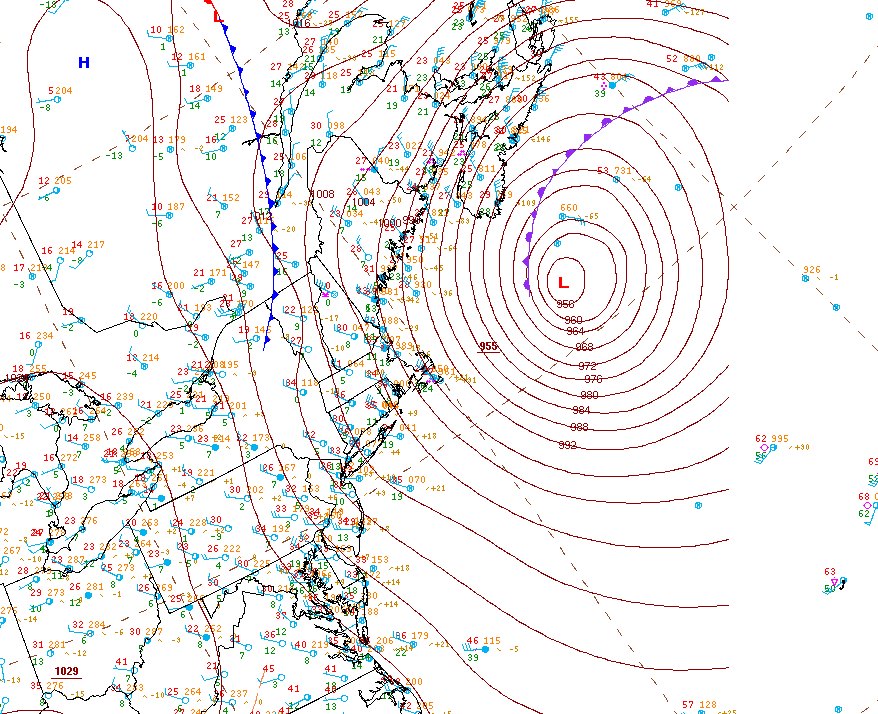
Surface analysis taken during the storm’s maturity showed it having a pressure of 955mb! Not surprisingly, a cyclone this mature had a well-defined occluded front (NOAA).
These are two of the main aspects that lead to storm development. There are actually more aspects than this, but the key takeaway is that being located in the left exit and right entrance regions of a jet streak, as well as being in an environment with a strong temperature gradient can lead to explosive storm development. In particular, there needs to be a situation where strong warm air advection can occur on the warm side of the storm, and strong cold air advection can occur on the cold side of the storm, as this leads to strengthening fronts and strengthening storms. In a surface Low Pressure system, the winds converge, since air flows from high pressures to lower pressures. This convergence at the surface leads to upward vertical motion, and thus a reinforced lower pressure at the surface. This process can particularly be augmented by divergence aloft via being in the left exit and right entrance region of a jet streak.
We will now leave you with a series of beautiful images from the powerful ocean storm that occurred on Wednesday.

A beautiful satellite image taken of the ocean storm, showing an eye-like feature, and a very strong line of thunderstorms on the southeast side of the storm (associated cold front). (NOAA).

Enhanced water vapor imagery of the powerful ocean storm. You may need to click to animate (wx.rutgers.edu).
Another beautiful enhanced water vapor image taken of the ocean storm (NASA).
The fact that the east side (warm side) of the storm was right over the Gulf Stream and its powerful circulation wrapped in plenty of cold air from Canada led to quite the impressive temperature gradient, so it is no surprise that the storm became so strong.
One final note: some of you may be wondering about the very prominent dry colors being shown in the water vapor imagery. This is actually an area of lots of dry air, which seems odd for a storm’s development; but it’s actually another classic indicator of a mature cyclone. All of those warm, moist colors on the southeast side of the storm is a bunch of convection out ahead of its strong cold front, and south of its strong warm front. This is where plentiful lift is occurring — it’s the warm sector. But what comes up must also come back down — the extremely strong areas of lift and precipitation are being balanced out by lots of subsidence and dry air behind it, which is reflected beautifully in the water vapor imagery.
Enjoy your weekend, everyone.
I used to be able to find good advice from your articles.
Link exchange is nothing else except it is just placing the other person’s web site link on your page at proper place and other person will also do similar
for you.
Great blog right here! Additionally your site rather a lot up
very fast! What host are you the use of? Can I get your associate
hyperlink on your host? I desire my site loaded up as quickly
as yours lol
You could certainly see your expertise in the article you write.
The world hopes for even more passionate writers like you
who aren’t afraid to say how they believe. At all times follow
your heart.
After exploring a number of the blog posts on your site, I
truly like your technique of blogging. I book marked it to my bookmark website list and will be checking back in the near
future. Please check out my website as well and tell me how you feel.
Hi, i think that i saw you visited my weblog so i came to “return the favor”.I’m trying to find things to improve my
website!I suppose its ok to use a few of your ideas!!
Thanks for sharing your info. I truly appreciate your efforts and I am waiting
for your next write ups thanks once again.
We stumbled over here from a different website and thought I should check things out.
I like what I see so now i am following you.
Look forward to looking over your web page yet again.
Nice blog here! Also your website loads up very fast!
What host are you using? Can I get your affiliate link to
your host? I wish my web site loaded up as fast as yours
lol
My brother suggested I might like this blog. He was entirely right.
This post actually made my day. You can not imagine
just how much time I had spent for this info!
Thanks!
Howdy this is somewhat of off topic but I was wanting to know if blogs use WYSIWYG editors or if you have
to manually code with HTML. I’m starting a blog
soon but have no coding expertise so I wanted to get advice from someone with experience.
Any help would be greatly appreciated!
Hmm is anyone else encountering problems with the images on this blog loading?
I’m trying to determine if its a problem on my
end or if it’s the blog. Any feed-back would be greatly appreciated.
Heya are using WordPress for your blog platform? I’m new
to the blog world but I’m trying to get started and set up my own.
Do you require any coding knowledge to make your own blog?
Any help would be greatly appreciated!
I always used to study post in news papers but now as I am
a user of net so from now I am using net for articles, thanks to
web.
You’ve made some good points there. I checked on the web for more information about the issue and found most individuals will go along with your views on this site.
Fabulous, what a blog it is! This weblog gives valuable information to us, keep it up.
I don’t even know the way I stopped up here, however I assumed this publish was once good.
I do not recognise who you are but definitely you’re
going to a famous blogger for those who aren’t already.
Cheers!
I like what you guys tend to be up too. This kind of clever work and coverage!
Keep up the good works guys I’ve included you
guys to blogroll.
I am actually grateful to the holder of this web site who has shared this enormous post at at this place.
Hi to every , because I am really keen of reading this blog’s post
to be updated regularly. It carries nice information.
I like the valuable info you provide in your articles. I will bookmark your weblog and check again here frequently.
I am quite certain I will learn a lot of new stuff right here!
Good luck for the next!
This is a good tip especially to those new to the blogosphere.
Short but very accurate information… Appreciate your sharing this
one. A must read article!
Touche. Sound arguments. Keep up the good effort.
Hi mates, good piece of writing and fastidious urging commented at this place, I am in fact enjoying by these.
You’ve made some good points there. I checked on the web to find
out more about the issue and found most people will go along with your views on this site.
I am in fact pleased to glance at this webpage posts which consists of tons
of helpful facts, thanks for providing these information.
Hi my loved one! I wish to say that this article is
amazing, nice written and come with approximately all vital infos.
I’d like to see extra posts like this .
This blog was… how do you say it? Relevant!! Finally I have found
something which helped me. Kudos!
I need to to thank you for this excellent read!! I definitely loved
every bit of it. I have you saved as a favorite to look at new stuff you post…
Its not my first time to visit this site, i am visiting this website dailly and get
good data from here every day.
Wow, this piece of writing is good, my sister is analyzing these things, so I am going
to convey her.
Hi to every single one, it’s actually a nice for me to pay a visit this web page, it consists
of useful Information.
Can I simply say what a comfort to find someone who truly understands what
they are talking about on the internet. You definitely know how to
bring a problem to light and make it important.
More people ought to check this out and understand this side of the story.
I can’t believe you are not more popular since you most certainly have the
gift.
I’m not sure why but this website is loading very slow for me.
Is anyone else having this problem or is it a problem on my end?
I’ll check back later and see if the problem still exists.
Hi to every body, it’s my first pay a visit of this blog; this
web site carries awesome and in fact good stuff designed for
readers.
If you are going for most excellent contents like me, only go to see this web site everyday
because it gives quality contents, thanks
Do you have a spam issue on this website; I also am a blogger,
and I was curious about your situation; we have created some nice practices and we
are looking to trade solutions with other folks, please shoot me
an email if interested.
Thanks for finally talking about > What causes storms to strengthen? – New York Metro Weather – NYC Weather Forecasts < Loved it!
Thanks for sharing your thoughts. I really appreciate your efforts and I am waiting for your next write ups thanks once
again.
Hi to every one, it’s genuinely a good for me to pay a visit this website, it contains valuable Information.
Hello There. I discovered your weblog using msn. This is a very well written article.
I’ll be sure to bookmark it and return to read extra of your helpful info.
Thanks for the post. I’ll certainly comeback.
Pretty! This has been a really wonderful post.
Many thanks for supplying this info.
I like what you guys are up too. This type of clever work and
reporting! Keep up the terrific works guys I’ve included you
guys to blogroll.
I know this website offers quality depending
content and additional material, is there any other web page which provides
these data in quality?
If some one wants expert view about blogging and site-building then i propose him/her to visit this website, Keep up the nice job.
Pretty! This was an extremely wonderful post. Thanks for providing this
info.
Why visitors still use to read news papers when in this technological globe everything
is existing on web?
Hi! Would you mind if I share your blog with my twitter group?
There’s a lot of folks that I think would really appreciate your
content. Please let me know. Many thanks
excellent points altogether, you simply gained a logo new reader.
What could you suggest about your publish that you simply made a few days ago?
Any certain?
Incredible points. Outstanding arguments. Keep up the great work.
This is my first time pay a quick visit at here and i am actually pleassant to
read all at one place.
Hi, this weekend is good designed for me, for the reason that this moment i am reading this impressive informative
post here at my home.
I always spent my half an hour to read this website’s posts all the time along with a cup of
coffee.
Hello, I enjoy reading through your article. I wanted to
write a little comment to support you.
At this time it sounds like WordPress is the best blogging platform available right now.
(from what I’ve read) Is that what you are using on your blog?
I have been surfing online more than 2 hours today,
yet I never found any interesting article like yours.
It’s pretty worth enough for me. In my opinion, if all site
owners and bloggers made good content as you did, the internet will be much more useful than ever before.
Fastidious respond in return of this difficulty with genuine arguments and telling all
concerning that.
Greetings from Idaho! I’m bored at work so I decided to check out
your blog on my iphone during lunch break.
I love the information you provide here and can’t wait to take a look when I get home.
I’m amazed at how fast your blog loaded on my cell
phone .. I’m not even using WIFI, just 3G .. Anyways, awesome site!
Heya! I just wanted to ask if you ever have any problems with hackers?
My last blog (wordpress) was hacked and I ended up losing many
months of hard work due to no data backup. Do you have any solutions to protect against hackers?
There is definately a lot to learn about this topic. I like all of
the points you have made.
Hi, I do believe this is an excellent blog. I stumbledupon it 😉 I will revisit once again since I bookmarked it.
Money and freedom is the greatest way to change, may you be rich and continue to guide others.
Someone essentially lend a hand to make severely articles I might state.
This is the first time I frequented your website page and up to now?
I surprised with the analysis you made to create this particular post amazing.
Great process!
You could certainly see your enthusiasm within the
work you write. The sector hopes for even more passionate writers like
you who are not afraid to mention how they believe. All
the time go after your heart.
Hi there Dear, are you actually visiting this website daily, if so after that you will definitely obtain nice knowledge.
Amazing issues here. I’m very satisfied to peer your
article. Thank you so much and I am having a look ahead to contact you.
Will you please drop me a mail?
When I initially left a comment I seem to have clicked on the -Notify me when new
comments are added- checkbox and from now on every time a comment
is added I recieve four emails with the same comment.
There has to be a way you can remove me from that service?
Thanks a lot!
Howdy! This is my first visit to your blog! We are a collection of volunteers and starting a new project in a community
in the same niche. Your blog provided us beneficial
information to work on. You have done a wonderful job!
Excellent beat ! I wish to apprentice at the same time as you amend your website, how can i subscribe for a weblog web site?
The account aided me a appropriate deal.
I were tiny bit familiar of this your broadcast offered bright clear concept
Hi there just wanted to give you a quick heads up.
The text in your post seem to be running off the screen in Ie.
I’m not sure if this is a format issue or something to do with browser compatibility but I figured I’d
post to let you know. The design look great though! Hope you get the problem resolved soon. Cheers
Wow that was odd. I just wrote an very long comment
but after I clicked submit my comment didn’t show up. Grrrr…
well I’m not writing all that over again. Anyways,
just wanted to say superb blog!
Hi there, I found your blog by means of Google at the same time as
searching for a comparable matter, your website came up, it appears
great. I have bookmarked it in my google bookmarks.
Hi there, just was aware of your blog through Google, and located that it is truly informative.
I’m going to be careful for brussels. I will appreciate in case you continue this in future.
A lot of other people can be benefited from your writing.
Cheers!
Hey would you mind sharing which blog platform you’re working
with? I’m going to start my own blog in the near future but I’m having a tough time selecting
between BlogEngine/Wordpress/B2evolution and Drupal. The reason I ask is
because your design seems different then most blogs and
I’m looking for something completely unique.
P.S Apologies for being off-topic but I had to ask!
Good site you have here.. It’s hard to find excellent writing like yours these days.
I seriously appreciate people like you! Take care!!
I like reading an article that can make people think.
Also, many thanks for allowing for me to comment!
I enjoy looking through a post that will make people
think. Also, thanks for allowing for me to comment!
Thanks for sharing your thoughts. I really appreciate your efforts
and I am waiting for your next post thanks once again.
Good way of telling, and good article to obtain facts concerning my presentation subject matter,
which i am going to present in academy.
It’s fantastic that you are getting ideas from this article as well
as from our argument made here.
First of all I want to say excellent blog! I had a quick question in which
I’d like to ask if you do not mind. I was interested to find out how you center
yourself and clear your mind prior to writing.
I have had a tough time clearing my thoughts in getting my thoughts out.
I truly do enjoy writing however it just seems like the first
10 to 15 minutes are lost just trying to figure out how to begin. Any suggestions or hints?
Cheers!
Appreciate this post. Will try it out.
I always used to study article in news papers but now as I am a user of web so from now I am using net for articles or reviews, thanks to web.
When someone writes an piece of writing he/she keeps the plan of a user in his/her mind that how a user can understand it.
So that’s why this paragraph is outstdanding.
Thanks!
When I initially commented I clicked the “Notify me when new comments are added” checkbox and now each time a comment is
added I get four emails with the same comment. Is there any way you can remove me from that service?
Bless you!
I’m really enjoying the design and layout of your blog. It’s a
very easy on the eyes which makes it much more pleasant for me to come here and visit more often. Did you hire out a designer to create your theme?
Fantastic work!
Helpful information. Lucky me I found your web site by accident, and I’m surprised why this coincidence
did not took place in advance! I bookmarked it.
Hi, I check your new stuff daily. Your humoristic style is awesome, keep it up!
I’ve been browsing online greater than 3 hours
today, but I never discovered any interesting article like yours.
It is lovely value enough for me. Personally, if all web
owners and bloggers made excellent content as you probably did, the web might be a lot more
helpful than ever before.
At this time I am going to do my breakfast, when having my breakfast coming
yet again to read further news.
If you want to grow your knowledge just keep visiting this web page and
be updated with the hottest gossip posted here.
Hello! I just wanted to ask if you ever have any
trouble with hackers? My last blog (wordpress) was hacked and I ended up losing many months
of hard work due to no backup. Do you have any methods to stop
hackers?
Pretty! This has been an extremely wonderful post.
Thank you for providing this info.
Great items from you, man. I’ve be aware your stuff
prior to and you are just too excellent. I really like what
you’ve obtained here, certainly like what you are stating and the way through which you are saying it.
You’re making it enjoyable and you still take care of to keep it
smart. I can not wait to learn far more from you. That is actually a
tremendous website.
Thanks for finally writing about > What causes storms to strengthen? – New York Metro Weather – NYC
Weather Forecasts < Liked it!
My brother recommended I would possibly like this blog.
He used to be totally right. This post truly made my day.
You cann’t believe simply how so much time I had spent for this information! Thanks!
Hi there, every time i used to check weblog posts here early in the dawn, as i love to gain knowledge of more and
more.
It’s very easy to find out any matter on net as compared
to books, as I found this post at this website.
If you would like to improve your experience only keep
visiting this web site and be updated with the newest gossip posted
here.
It’s going to be finish of mine day, but before ending I am reading this wonderful piece of
writing to increase my knowledge.
I used to be able to find good info from your articles.
I all the time used to read paragraph in news papers but now
as I am a user of net thus from now I am using net for content,
thanks to web.
You have made some decent points there. I checked on the web to find out more about
the issue and found most individuals will go along
with your views on this web site.
I got this website from my friend who shared with me about this website and at the moment this time I am visiting this web site and reading very informative content at
this place.
If some one desires to be updated with hottest technologies
after that he must be go to see this website and be up to date every day.
This piece of writing is truly a good one it helps new web viewers, who are wishing in favor of blogging.
I visited many blogs however the audio feature for audio songs current at this web site is genuinely fabulous.
It’s fantastic that you are getting ideas from this article
as well as from our discussion made here.
It’s impressive that you are getting ideas from this article as well as from our dialogue made
at this time.
This article will help the internet viewers for building up new webpage
or even a weblog from start to end.
I read this paragraph fully regarding the difference of hottest and earlier technologies, it’s remarkable article.
What i don’t realize is actually how you’re now not actually much more well-preferred than you might be now.
You are very intelligent. You realize therefore
considerably in relation to this topic, produced me in my view believe it from numerous numerous angles.
Its like men and women aren’t fascinated unless it’s something to accomplish
with Lady gaga! Your personal stuffs nice.
Always deal with it up!
Ahaa, its good dialogue on the topic of this article here at this weblog, I have read all that, so at this
time me also commenting at this place.
I just like the valuable information you supply for your
articles. I’ll bookmark your weblog and
test again right here regularly. I am slightly sure I will
be informed a lot of new stuff proper right here!
Good luck for the next!
Oh my goodness! Awesome article dude! Thank you so much, However I am experiencing problems with your RSS.
I don’t know the reason why I cannot join it.
Is there anyone else having identical RSS problems?
Anyone that knows the solution can you kindly respond?
Thanx!!
Hey would you mind stating which blog platform you’re working with?
I’m planning to start my own blog soon but I’m having a hard time selecting between BlogEngine/Wordpress/B2evolution and Drupal.
The reason I ask is because your design seems
different then most blogs and I’m looking for something unique.
P.S Sorry for being off-topic but I had to ask!
Hi Dear, are you genuinely visiting this site on a regular basis,
if so then you will without doubt obtain fastidious knowledge.
Oh my goodness! Impressive article dude!
Many thanks, However I am going through problems with your RSS.
I don’t understand why I cannot join it. Is there anyone else getting similar RSS problems?
Anyone that knows the answer can you kindly respond?
Thanx!!
An impressive share! I have just forwarded this onto a colleague who was doing a little research on this.
And he in fact ordered me lunch due to the fact that
I found it for him… lol. So let me reword this….
Thank YOU for the meal!! But yeah, thanks for spending time to talk about this matter
here on your web page.
I visited multiple web sites however the audio feature for audio
songs existing at this site is in fact marvelous.
This post is priceless. Where can I find out more?
Yes! Finally someone writes about buy fire extinguisher.
If some one needs expert view concerning running a blog after that i recommend him/her to pay a quick
visit this blog, Keep up the fastidious job.
Excellent beat ! I would like to apprentice whilst you amend your site, how could i subscribe for a weblog site?
The account helped me a acceptable deal. I were a little bit acquainted of this your broadcast offered bright transparent concept
This post gives clear idea in favor of the new users of blogging, that truly
how to do running a blog.
Thanks in favor of sharing such a nice thought, post is fastidious, thats why i have read it completely
Hi to all, how is the whole thing, I think every one is getting more from this web page, and your
views are fastidious designed for new visitors.
Hi there it’s me, I am also visiting this web site regularly, this web page is really
pleasant and the viewers are really sharing nice thoughts.
Hey I know this is off topic but I was wondering if you knew of any widgets I could add to
my blog that automatically tweet my newest twitter updates.
I’ve been looking for a plug-in like this for quite some
time and was hoping maybe you would have some experience with something like this.
Please let me know if you run into anything. I truly enjoy reading your blog and I look forward to your new updates.
You have made some really good points there. I looked on the web for additional information about the issue and found most individuals will go along with
your views on this website.
Please let me know if you’re looking for a article author for your weblog.
You have some really good posts and I think I would be a
good asset. If you ever want to take some of the load off, I’d
absolutely love to write some material for your blog in exchange for a
link back to mine. Please send me an email if interested.
Kudos!
It’s appropriate time to make some plans for the future
and it’s time to be happy. I’ve read this post and if I could I want to suggest you some interesting things
or tips. Perhaps you could write next articles referring to this article.
I wish to read even more things about it!
Hello! Quick question that’s entirely off topic.
Do you know how to make your site mobile friendly?
My web site looks weird when viewing from my iphone 4. I’m trying to find
a theme or plugin that might be able to resolve this problem.
If you have any recommendations, please share. Thanks!
Very soon this site will be famous amid all blog
users, due to it’s pleasant articles
Woah! I’m really enjoying the template/theme of this site.
It’s simple, yet effective. A lot of times it’s challenging to get that “perfect balance” between superb usability and visual appearance.
I must say you’ve done a fantastic job with this.
Also, the blog loads very quick for me on Safari.
Superb Blog!
Greetings! This is my first visit to your blog! We
are a team of volunteers and starting a new project in a community in the same
niche. Your blog provided us useful information to work on. You have done a wonderful job!
Awesome! Its actually amazing paragraph, I have got much clear idea regarding from
this piece of writing.
What’s Happening i am new to this, I stumbled upon this I have discovered It positively helpful
and it has helped me out loads. I am hoping to give a contribution & assist other customers like its aided me.
Good job.
It’s appropriate time to make some plans for the future and it’s time to be happy.
I have learn this publish and if I may I desire
to recommend you few fascinating things or advice.
Maybe you can write next articles relating to this article.
I desire to learn more issues approximately it!
Stunning quest there. What happened after? Take care!
Thank you for every other informative website. Where else may just I
am getting that type of info written in such a
perfect way? I have a challenge that I am simply now working on, and I’ve been at the glance out for such information.
Wonderful, what a web site it is! This web site gives helpful information to us, keep it up.
Have you ever considered writing an e-book or guest authoring
on other websites? I have a blog based on the same information you discuss and
would love to have you share some stories/information. I know
my visitors would value your work. If you’re even remotely interested, feel free to send me an e-mail.
Just wish to say your article is as astonishing. The clearness in your publish is just nice and that i could
suppose you are an expert in this subject. Well together with your permission let me
to grab your feed to keep up to date with impending
post. Thank you a million and please keep up the enjoyable work.
Sweet blog! I found it while searching on Yahoo News.
Do you have any tips on how to get listed in Yahoo News? I’ve been trying for a while but I never seem to get there!
Appreciate it
My family every time say that I am wasting my time here at web,
but I know I am getting experience all the time by reading such good articles.
Excellent pieces. Keep writing such kind of information on your page.
Im really impressed by it.
Hey there, You have done an excellent job.
I’ll certainly digg it and in my opinion suggest to my friends.
I am sure they’ll be benefited from this website.
Please let me know if you’re looking for a writer for
your blog. You have some really good posts and I think I would be
a good asset. If you ever want to take some of the load off, I’d absolutely love to write some articles for your blog in exchange for
a link back to mine. Please blast me an email if interested.
Kudos!
I’m impressed, I must say. Seldom do I come across a blog that’s both educative and engaging, and without a doubt, you’ve hit the nail
on the head. The issue is something that too few men and women are speaking intelligently about.
I’m very happy that I stumbled across this in my hunt for
something concerning this.
Definitely believe that which you stated. Your favorite reason seemed to be on the
net the simplest thing to be aware of. I say to you, I certainly get irked while people consider worries that they plainly don’t know about.
You managed to hit the nail upon the top as well as defined out the whole thing without having side-effects , people can take
a signal. Will likely be back to get more.
Thanks
I really like what you guys are up too. This type of clever work and
coverage! Keep up the awesome works guys I’ve added you guys to our blogroll.
Hello! I’m at work surfing around your blog from my new apple iphone!
Just wanted to say I love reading through your
blog and look forward to all your posts! Carry on the
fantastic work!
If you want to grow your knowledge just keep visiting this website and be updated with the most up-to-date gossip posted here.
When someone writes an post he/she maintains the idea of a
user in his/her mind that how a user can know it. So that’s why this post is
great. Thanks!
Thanks for a marvelous posting! I truly enjoyed reading it, you’re a great author.
I will be sure to bookmark your blog and will come back at some point.
I want to encourage one to continue your great work, have a
nice afternoon!
This is my first time go to see at here and i am genuinely pleassant to read everthing at single place.
I have learn a few good stuff here. Definitely worth bookmarking
for revisiting. I surprise how a lot effort you put to make any
such excellent informative website.
This piece of writing is in fact a good one it helps new net visitors, who are wishing for blogging.
I have been exploring for a little for any high-quality articles or weblog posts in this kind of house .
Exploring in Yahoo I at last stumbled upon this site. Studying this information So i’m glad to exhibit that I have a very good uncanny feeling I came upon just what I needed.
I such a lot definitely will make sure to don?t
overlook this web site and provides it a glance on a constant basis.
This is the perfect site for anyone who wishes to find out about this topic.
You realize a whole lot its almost hard to argue with you (not that I actually will need
to…HaHa). You certainly put a new spin on a topic which
has been discussed for many years. Great stuff,
just excellent!
What i do not realize is if truth be told how you’re not really much more neatly-favored than you may be right now.
You’re very intelligent. You realize thus considerably when it comes to this subject, made me individually
consider it from so many various angles. Its like men and women aren’t fascinated except it
is something to accomplish with Lady gaga! Your own stuffs great.
Always maintain it up!
WOW just what I was searching for. Came here by searching for wheelchair lightweight
I have read so many articles or reviews about the blogger lovers
however this article is in fact a pleasant piece of writing, keep it
up.
If some one needs expert view regarding blogging afterward i propose him/her to visit
this website, Keep up the good work.
It’s wonderful that you are getting thoughts from this article as well
as from our discussion made here.
Nice blog here! Also your web site loads up fast!
What host are you using? Can I get your affiliate link to
your host? I wish my site loaded up as fast as yours lol
Good day! I could have sworn I’ve been to
this website before but after browsing through some of the post I
realized it’s new to me. Anyhow, I’m definitely glad I found it and I’ll
be book-marking and checking back frequently!
I don’t know whether it’s just me or if perhaps everyone
else encountering issues with your website. It seems like some of
the text on your posts are running off the screen. Can somebody else
please comment and let me know if this is happening to them too?
This may be a issue with my internet browser because I’ve
had this happen before. Thank you
It’s an amazing piece of writing in favor of all
the web people; they will take benefit from it I
am sure.
Hello my family member! I want to say that this article is amazing,
nice written and come with almost all vital infos.
I’d like to peer extra posts like this .
Nice post. I was checking constantly this blog and I am impressed!
Very useful information specifically the last part 🙂 I care for such information a lot.
I was looking for this particular info for a very long time.
Thank you and best of luck.
What’s up, of course this article is truly pleasant and I
have learned lot of things from it concerning blogging.
thanks.
Excellent, what a webpage it is! This webpage presents useful information to us,
keep it up.
I constantly spent my half an hour to read this blog’s articles or reviews daily along with a mug of coffee.
What i don’t realize is if truth be told how you are not really much more smartly-liked than you might be now.
You’re so intelligent. You know therefore significantly in relation to this
subject, produced me in my opinion consider it from so
many numerous angles. Its like men and women are not involved until it’s something
to accomplish with Lady gaga! Your personal stuffs nice.
All the time deal with it up!
I love your blog.. very nice colors & theme. Did you make this website yourself or did
you hire someone to do it for you? Plz respond as I’m looking to construct my own blog and would like to find
out where u got this from. cheers
Since the admin of this web site is working, no uncertainty very soon it will be
renowned, due to its feature contents.
Pretty! This has been an extremely wonderful article.
Thanks for supplying this information.
Oh my goodness! Amazing article dude! Thank you, However I
am encountering problems with your RSS.
I don’t know why I can’t join it. Is there anybody
having identical RSS problems? Anyone who knows the answer will you kindly respond?
Thanx!!
I think that everything wrote was very reasonable.
But, consider this, what if you added a little content?
I mean, I don’t wish to tell you how to run your website,
however suppose you added a post title that makes people desire
more? I mean What causes storms to strengthen? – New York Metro Weather –
NYC Weather Forecasts is kinda vanilla. You could look at Yahoo’s front page
and see how they create news titles to get people interested.
You might add a video or a pic or two to grab people excited about everything’ve written. Just my opinion, it could make your website a little bit more interesting.
My spouse and I absolutely love your blog and find most of
your post’s to be just what I’m looking for.
Would you offer guest writers to write content to suit your needs?
I wouldn’t mind composing a post or elaborating on a lot of the subjects you write with regards
to here. Again, awesome blog!
It’s an amazing post for all the online people; they will obtain benefit from it I am sure.
When some one searches for his essential thing, thus he/she desires to be available that in detail, therefore that thing is
maintained over here.
hello there and thank you for your information – I’ve
certainly picked up anything new from right here.
I did however expertise some technical points
using this web site, since I experienced to reload the
site a lot of times previous to I could get it to load correctly.
I had been wondering if your web hosting is OK?
Not that I am complaining, but slow loading instances times will very frequently affect your placement in google and can damage your quality score if advertising and marketing
with Adwords. Anyway I’m adding this RSS to my
email and could look out for much more of your respective exciting content.
Ensure that you update this again soon.
Hello there, I discovered your website by the use of
Google at the same time as searching for a related topic, your web site got here up, it appears good.
I have bookmarked it in my google bookmarks.
Hello there, simply became alert to your weblog thru Google, and found that
it’s really informative. I am gonna be careful for brussels.
I’ll appreciate in case you continue this in future.
Lots of people will be benefited out of your writing.
Cheers!
Do you have a spam problem on this site; I also am a blogger, and
I was wondering your situation; we have developed some nice procedures and we are looking to swap solutions with other folks, please shoot me an e-mail if interested.
This blog was… how do you say it? Relevant!! Finally I’ve found something which
helped me. Kudos!
This is a topic that’s close to my heart… Thank you! Where
are your contact details though?
It is appropriate time to make some plans for the future and it is time
to be happy. I have read this post and if I could
I want to suggest you few interesting things or tips.
Maybe you can write next articles referring to this article.
I desire to read even more things about it!
I pay a visit daily a few sites and information sites to read articles, except this
website provides feature based posts.
I’m truly enjoying the design and layout of your site.
It’s a very easy on the eyes which makes it much
more pleasant for me to come here and visit more often. Did you hire out a designer to create your theme?
Fantastic work!
You made some decent points there. I looked on the internet for more info about the issue and found most people will go along with
your views on this site.
I’m really enjoying the theme/design of your site.
Do you ever run into any browser compatibility problems?
A small number of my blog readers have complained about
my blog not working correctly in Explorer but looks great in Opera.
Do you have any ideas to help fix this issue?
Hello it’s me, I am also visiting this site on a regular basis, this web page is actually
pleasant and the visitors are actually sharing fastidious thoughts.
I am actually happy to read this webpage posts which carries
tons of useful information, thanks for providing such data.
Just desire to say your article is as astounding. The clarity in your publish is just great
and i can assume you are knowledgeable on this subject. Fine along with your permission allow me to clutch your feed to keep updated with coming near near
post. Thanks 1,000,000 and please carry on the enjoyable work.
After going over a few of the blog articles on your blog, I really appreciate your technique of
blogging. I saved as a favorite it to my bookmark webpage
list and will be checking back soon. Please check out my website as well and tell me
what you think.
Hi there! Do you use Twitter? I’d like to follow you if that would be okay.
I’m absolutely enjoying your blog and look forward to new posts.
Hello to every one, it’s really a nice for me to go to
see this site, it consists of priceless Information.
Wow, marvelous weblog format! How lengthy have you been blogging for?
you made blogging glance easy. The entire glance of your web site is great, as smartly as the content material!
Hello, I enjoy reading through your article post. I wanted to write a little comment to support you.
Good day I am so delighted I found your site, I really found you by error, while I was researching on Digg for something
else, Anyways I am here now and would just like to say thanks for a marvelous post and a all round
enjoyable blog (I also love the theme/design), I don’t have time to go through it all at the moment but
I have saved it and also added your RSS feeds, so when I have time I
will be back to read more, Please do keep up the fantastic jo.
May I just say what a comfort to uncover an individual who
truly understands what they are discussing online.
You actually know how to bring an issue to light and make it important.
More people have to read this and understand this side of the story.
I can’t believe you aren’t more popular given that you definitely have the gift.
Very energetic post, I enjoyed that bit. Will there be a part 2?
Hi! I just wanted to ask if you ever have any issues with hackers?
My last blog (wordpress) was hacked and I ended up losing a few months of hard work due to no backup.
Do you have any methods to prevent hackers?
Excellent post. I was checking constantly this blog and I’m impressed!
Extremely helpful information particularly the last part 🙂 I care for such information much.
I was looking for this particular information for a very long time.
Thank you and best of luck.
I’m extremely impressed with your writing skills as well as
with the layout on your blog. Is this a paid theme or did you customize it yourself?
Anyway keep up the nice quality writing, it is rare to see
a great blog like this one today.
At this moment I am ready to do my breakfast, when having my breakfast
coming again to read other news.
Thanks for some other fantastic article.
Where else may anybody get that kind of information in such an ideal approach of writing?
I have a presentation subsequent week, and I am on the look for such information.
This info is priceless. When can I find out more?
Thanks for one’s marvelous posting! I truly enjoyed reading it, you
are a great author.I will make sure to bookmark your
blog and will often come back later on. I want to encourage you continue your
great posts, have a nice day!
First of all I would like to say wonderful blog! I had a quick question that I’d like to ask if you do not mind.
I was interested to know how you center yourself and clear your thoughts before writing.
I’ve had difficulty clearing my mind in getting my ideas out there.
I truly do enjoy writing however it just seems like the first 10 to 15 minutes
tend to be lost simply just trying to figure
out how to begin. Any recommendations or hints?
Many thanks!
It’s actually a cool and useful piece of info.
I’m happy that you just shared this helpful
info with us. Please keep us informed like this. Thanks for sharing.
WOW just what I was looking for. Came here by searching for Group Tours in Wrangell
Do you mind if I quote a few of your articles as long as I provide
credit and sources back to your blog? My website is in the very same
niche as yours and my visitors would definitely benefit from a
lot of the information you present here. Please let me know if this okay
with you. Thanks a lot!
Link exchange is nothing else but it is simply placing the other person’s web site link on your page at proper place and other
person will also do same for you.
You actually make it seem so easy with your presentation but I find this topic to be really something which I think I would never understand.
It seems too complicated and very broad for me. I am looking
forward for your next post, I will try to get the hang of it!
Right away I am going away to do my breakfast, once having
my breakfast coming over again to read further news.
What’s Going down i’m new to this, I stumbled upon this I have found It absolutely helpful and it
has aided me out loads. I am hoping to contribute & assist different users like its helped me.
Great job.
We are a bunch of volunteers and opening a brand new scheme in our community.
Your website provided us with valuable information to work on.
You have done a formidable activity and our whole community will be
grateful to you.
Informative article, totally what I wanted
to find.
Thanks in favor of sharing such a nice opinion, paragraph is good, thats why i have read it completely
Hey! Do you know if they make any plugins to safeguard against hackers?
I’m kinda paranoid about losing everything
I’ve worked hard on. Any recommendations?
Howdy! This article couldn’t be written much better!
Reading through this post reminds me of my previous roommate!
He always kept preaching about this. I will send this post to him.
Fairly certain he’ll have a great read. Thank you
for sharing!
hello!,I like your writing very so much! percentage we communicate extra approximately your post on AOL?
I need an expert on this area to solve my problem. Maybe that’s
you! Having a look forward to look you.
Hello i am kavin, its my first time to commenting anywhere, when i read this piece of writing i thought i could also make comment due to this sensible post.
Hi there! This is my 1st comment here so I just wanted to give a
quick shout out and tell you I genuinely enjoy reading through your articles.
Can you recommend any other blogs/websites/forums that deal
with the same topics? Thank you!
It’s amazing to pay a quick visit this website and reading the views
of all friends regarding this piece of writing,
while I am also zealous of getting familiarity.
Hi! Would you mind if I share your blog with my facebook group?
There’s a lot of folks that I think would really appreciate your content.
Please let me know. Cheers
You are so awesome! I don’t believe I’ve read through anything like this before.
So great to discover somebody with some unique thoughts on this subject matter.
Really.. thanks for starting this up. This website is one thing that is required
on the internet, someone with a bit of originality!
Hello everyone, it’s my first pay a quick visit at this site,
and article is actually fruitful in support of me, keep up posting
these content.
Hello, i believe that i noticed you visited my web site thus i
got here to return the prefer?.I am trying to to
find things to improve my website!I assume its good enough to use a few of your concepts!!
Hello, all is going fine here and ofcourse every one is sharing data, that’s really fine, keep
up writing.
Spot on with this write-up, I honestly believe that this web
site needs far more attention. I’ll probably
be back again to see more, thanks for the advice!
I think this is among the most important information for me.
And i am glad reading your article. But should remark on few general things, The web site style is ideal,
the articles is really nice : D. Good job, cheers
If some one desires to be updated with latest technologies after that he must be
visit this web site and be up to date daily.
Very nice article, exactly what I needed.
Yes! Finally something about brooklyn fire extinguisher inspection.
I’m not sure where you are getting your info, but great topic.
I needs to spend some time learning much more or understanding more.
Thanks for excellent info I was looking for this info for my mission.
I’m not sure exactly why but this web site is loading extremely slow for me.
Is anyone else having this issue or is it a issue on my end?
I’ll check back later on and see if the problem still exists.
Unquestionably consider that that you stated. Your
favourite reason seemed to be on the net the simplest thing
to understand of. I say to you, I certainly get annoyed
while folks consider worries that they plainly do not recognize about.
You managed to hit the nail upon the top as well as outlined out
the whole thing with no need side-effects , other people
could take a signal. Will probably be again to get more.
Thanks
Wow, amazing weblog layout! How lengthy have you been running a blog for?
you made blogging look easy. The total glance of your site is fantastic, as smartly as the content!
Aw, this was a really good post. Taking the time and actual effort to generate a great
article… but what can I say… I put things off a whole lot and
never manage to get anything done.
Hey there just wanted to give you a brief heads up and let you know a
few of the pictures aren’t loading properly. I’m not sure why but I think
its a linking issue. I’ve tried it in two different browsers and both show
the same results.
Pretty part of content. I simply stumbled upon your
website and in accession capital to assert that I acquire
actually enjoyed account your weblog posts. Any way I will be subscribing on your
feeds or even I success you get entry to constantly fast.
I’m not that much of a online reader to be honest but your blogs really nice, keep it up!
I’ll go ahead and bookmark your website to come back later.
All the best
Genuinely no matter if someone doesn’t be aware of afterward its
up to other people that they will help, so here it
takes place.
Hey very interesting blog!
Hi there, You have done an incredible job. I’ll certainly digg it and personally
suggest to my friends. I’m sure they’ll be benefited from this
web site.
What’s up to every one, the contents existing at this web site are really awesome for people knowledge,
well, keep up the nice work fellows.
Hey there! I know this is sort of off-topic but I had to ask.
Does running a well-established blog such as yours require a lot of work?
I am completely new to operating a blog but I do write
in my diary everyday. I’d like to start a blog so I can share my
own experience and views online. Please let me know if you have any recommendations or tips for
brand new aspiring bloggers. Appreciate it!
My programmer is trying to persuade me to move to
.net from PHP. I have always disliked the idea because of the expenses.
But he’s tryiong none the less. I’ve been using Movable-type
on a number of websites for about a year and am concerned about switching to another platform.
I have heard fantastic things about blogengine.net.
Is there a way I can transfer all my wordpress content into it?
Any help would be really appreciated!
Hello there, I do think your website could possibly be having internet browser compatibility problems.
When I take a look at your blog in Safari, it looks fine but when opening in I.E., it’s got some overlapping issues.
I merely wanted to provide you with a quick heads up!
Apart from that, wonderful site!
Nice post. I learn something totally new and challenging on sites
I stumbleupon on a daily basis. It will always be useful to read through content from other writers and use a little
something from other sites.
It’s very simple to find out any matter on web as compared to books, as I found this piece of writing at this website.
Hi, for all time i used to check webpage posts here in the early hours in the break of day, since i love
to gain knowledge of more and more.
My brother recommended I might like this blog. He was entirely right.
This post actually made my day. You cann’t imagine just how much time I had spent for
this info! Thanks!
Hello my friend! I want to say that this post is awesome,
great written and include approximately all important infos.
I would like to see more posts like this .
Hey there! I just wanted to ask if you ever have
any issues with hackers? My last blog (wordpress) was hacked and I
ended up losing a few months of hard work due to no
back up. Do you have any methods to stop hackers?
Usually I do not read post on blogs, however I wish
to say that this write-up very compelled me
to try and do it! Your writing taste has been amazed me.
Thank you, very great post.
I think the admin of this website is really working hard in support of his website, as here every
information is quality based data.
Just desire to say your article is as astounding. The clarity in your post
is simply excellent and i can assume you are an expert
on this subject. Fine with your permission allow me to
grab your feed to keep up to date with forthcoming
post. Thanks a million and please keep up the gratifying work.
Hello, I think your site may be having web browser compatibility issues.
When I take a look at your web site in Safari, it looks fine however, when opening in IE, it has some overlapping issues.
I just wanted to give you a quick heads up! Apart from that, fantastic blog!
It’s an amazing post in support of all the online viewers; they will
take benefit from it I am sure.
I always used to study piece of writing in news papers but now as I am a user of net thus from now I am using net for posts, thanks
to web.
What i don’t realize is in truth how you’re not really a lot more well-preferred than you may be right
now. You’re so intelligent. You already know thus significantly with regards to this matter, made me in my view believe it from a lot of numerous angles.
Its like women and men don’t seem to be involved unless it is something to accomplish with Girl gaga!
Your own stuffs nice. At all times care for it up!
What’s up to every one, for the reason that I am in fact eager of reading this
webpage’s post to be updated regularly. It includes fastidious stuff.
I know this if off topic but I’m looking into starting my own blog and was curious
what all is needed to get set up? I’m assuming having a blog
like yours would cost a pretty penny? I’m not very internet savvy so I’m not 100% positive.
Any recommendations or advice would be greatly appreciated.
Many thanks
I used to be suggested this blog by way of my cousin. I’m now not sure whether
this post is written through him as nobody else recognize such designated approximately
my problem. You are amazing! Thanks!
Hi there! Quick question that’s completely off topic.
Do you know how to make your site mobile friendly?
My weblog looks weird when viewing from my iphone 4.
I’m trying to find a template or plugin that might be able to correct this problem.
If you have any recommendations, please share.
Cheers!
you’re actually a excellent webmaster. The website loading pace is incredible.
It seems that you’re doing any distinctive trick.
In addition, The contents are masterwork.
you have done a magnificent task in this matter!
Hi to all, the contents present at this web page are actually amazing for people experience,
well, keep up the good work fellows.
I read this paragraph completely regarding the comparison of newest and preceding
technologies, it’s amazing article.
Thanks on your marvelous posting! I quite enjoyed reading
it, you may be a great author. I will remember to bookmark your blog and will often come back from now on. I want to encourage you continue your great writing, have a nice
weekend!
Thanks for a marvelous posting! I genuinely enjoyed reading it, you could be a great author.
I will be sure to bookmark your blog and will come back down the road.
I want to encourage you to ultimately continue
your great posts, have a nice holiday weekend!
Thank you a bunch for sharing this with all people you actually
realize what you are talking about! Bookmarked. Kindly additionally consult with my site =).
We could have a link exchange contract among
us
It’s going to be finish of mine day, except before ending I am reading this fantastic
paragraph to increase my knowledge.
Please let me know if you’re looking for a author for your weblog.
You have some really great posts and I think I would be a good asset.
If you ever want to take some of the load off, I’d absolutely
love to write some material for your blog in exchange for a
link back to mine. Please blast me an e-mail if interested.
Thanks!
Greetings! Very helpful advice in this particular article!
It is the little changes that produce the largest changes.
Thanks a lot for sharing!
Hey I know this is off topic but I was wondering if you knew
of any widgets I could add to my blog that automatically
tweet my newest twitter updates. I’ve been looking for
a plug-in like this for quite some time and was hoping maybe you would have some experience with something like this.
Please let me know if you run into anything.
I truly enjoy reading your blog and I look forward to your new updates.
Simply want to say your article is as astonishing. The clarity in your put up is just excellent
and i could think you’re an expert on this subject.
Fine together with your permission allow me to grasp your feed to keep up to date with drawing close post.
Thank you 1,000,000 and please carry on the rewarding work.
Hello there, just became aware of your blog through Google, and found that it
is really informative. I’m gonna watch out
for brussels. I’ll appreciate if you continue this in future.
A lot of people will be benefited from your writing.
Cheers!
This post is genuinely a good one it assists new the web users, who are wishing in favor of blogging.
Have you ever thought about creating an ebook or guest authoring on other websites?
I have a blog centered on the same information you discuss and would
really like to have you share some stories/information. I know my viewers
would appreciate your work. If you are even remotely
interested, feel free to send me an email.
I pay a quick visit everyday a few blogs and blogs to read content, but this weblog
presents feature based writing.
Thanks for finally talking about > What causes storms to strengthen? – New York Metro Weather – NYC Weather Forecasts < Liked it!
I am genuinely thankful to the owner of this site who has shared this enormous paragraph at at
this place.
I do accept as true with all of the ideas you have offered on your post.
They are very convincing and can certainly work. Nonetheless, the
posts are too short for beginners. May just you please extend them a little from subsequent time?
Thank you for the post.
Very great post. I simply stumbled upon your blog and wished to say that I’ve truly loved browsing your weblog posts.
After all I’ll be subscribing on your rss feed and
I am hoping you write again very soon!
This post offers clear idea in favor of the new users of blogging,
that actually how to do running a blog.
Hey there I am so excited I found your webpage, I really found you by error, while I
was searching on Google for something else, Nonetheless I am here now and would just like to say kudos for a fantastic post
and a all round entertaining blog (I also love the theme/design),
I don’t have time to read through it all at
the moment but I have bookmarked it and also included your RSS feeds, so when I have time I
will be back to read much more, Please do keep up the
awesome jo.
Hi there i am kavin, its my first occasion to commenting anyplace,
when i read this paragraph i thought i could also make comment due to this good
article.
I have read so many content about the blogger lovers except this article is truly a pleasant paragraph, keep it up.
Howdy! I’m at work browsing your blog from my new iphone 4!
Just wanted to say I love reading through your blog and look forward to all your posts!
Carry on the fantastic work!
hi!,I like your writing so much! share we keep up a correspondence more approximately your article on AOL?
I require an expert in this space to unravel my problem.
Maybe that is you! Taking a look ahead to see you.
Wonderful post however I was wanting to know if you could write a litte more on this topic?
I’d be very grateful if you could elaborate a little bit further.
Bless you!
This information is invaluable. Where can I find out more?
Great article.
It’s an awesome article in favor of all the
online users; they will take advantage from it
I am sure.
I will right away grab your rss as I can not to find your e-mail subscription link or newsletter service.
Do you’ve any? Please allow me know in order that I may subscribe.
Thanks.
Excellent beat ! I wish to apprentice whilst you amend your
site, how can i subscribe for a weblog site?
The account helped me a appropriate deal.
I have been a little bit familiar of this your broadcast provided
shiny clear idea
Excellent way of explaining, and nice article to obtain information regarding
my presentation topic, which i am going to present in college.
This site was… how do I say it? Relevant!! Finally I have
found something that helped me. Kudos!
When someone writes an paragraph he/she retains the thought of a user in his/her mind that how a user can know it.
So that’s why this post is great. Thanks!
Pretty great post. I just stumbled upon your blog and wanted to mention that I’ve really enjoyed browsing your weblog posts.
In any case I will be subscribing to your rss feed and I am hoping you
write once more soon!
I’m not sure why but this site is loading extremely slow for me.
Is anyone else having this issue or is it a issue on my end?
I’ll check back later and see if the problem still exists.
Hello, the whole thing is going perfectly here and ofcourse every one
is sharing information, that’s really good, keep up writing.
When I initially commented I clicked the “Notify me when new comments are added” checkbox and
now each time a comment is added I get three emails with the
same comment. Is there any way you can remove me from
that service? Thank you!
Hi, I believe your site may be having web browser
compatibility problems. Whenever I look at your blog in Safari, it looks fine however,
when opening in I.E., it has some overlapping issues.
I just wanted to give you a quick heads up! Besides that, excellent
website!
I have been surfing online more than 4 hours today, yet I
never found any interesting article like yours. It’s pretty worth enough for me.
In my view, if all web owners and bloggers made good content as you did,
the internet will be a lot more useful than ever before.
This is my first time visit at here and i am really impressed to read all at single place.
Do you have a spam issue on this blog; I also
am a blogger, and I was wanting to know your situation;
many of us have created some nice procedures and we are looking to swap techniques with others, be sure
to shoot me an e-mail if interested.
Thanks designed for sharing such a pleasant idea, paragraph
is good, thats why i have read it fully
I have been exploring for a bit for any high quality articles or blog posts
on this sort of house . Exploring in Yahoo I eventually
stumbled upon this website. Reading this information So
i’m happy to show that I’ve an incredibly excellent uncanny
feeling I discovered exactly what I needed. I such a lot indubitably
will make sure to do not overlook this site and provides it a glance on a relentless
basis.
I was able to find good information from your blog posts.