-2")
Moderate to strong El Nino becoming increasingly likely
While our area has been enjoying a stretch of pleasant and warmer weather, many meteorologists and weather hobbyists alike have been analyzing interesting data in the Equatorial Pacific: signs of a developing El Nino. An El Nino is generally defined as a trimonthly period where waters in the Equatorial Pacific — from 160 Degrees East to 80 Degrees West Longitude — are warmer than normal. This tends to have effects on the general atmospheric circulation, which will be detailed in this article. The Climate Prediction Center breaks this area into four different Nino regions, since warm anomalies in different regions of the Equatorial Pacific can lead to subtle, yet important changes in how the El Nino behaves.
The four El Nino regions (NCDC).
The region used to officially define an El Nino event is Nino 3.4, which spans from about 170 Degrees West to 120 Degrees West. That is not to say that the other regions are not important; they are just not used in the official calculation. Let’s take a look at an example of an El Nino event:
The strong El Nino event of 1997-1998. Notice how warm the waters are in the eastern Equatorial Pacific (CPC).
The El Nino of 1997-1998 was the strongest on record, as it had temperature anomalies between +2C and +5C across the eastern Equatorial Pacific. Also notice how the warmest anomalies were east of Nino region 3.4, which is a classic strong El Nino phenomenon. Let’s see how the forecast from one of our climate models compares to the 1997-1998 event.

The latest CFS model run shows an El Nino emerging (CPC).
The values on the left are anomalies in Kelvin, which can also be represented by degrees Celsius, since the incremental increases are the same for Kelvin and degrees Celsius. On the bottom, we see tri-monthly periods. The wavy black line shows what had previously been happening — generally, there was no anomaly at all, indicating no El Nino, nor its counterpart, a La Nina. However, moving forward in time, notice how all of the lines, which represent forecasting members, show a pretty fast increase in the anomaly through the coming months. Another interesting point is how the red lines are the earlier members, and the blue lines are the latest members — and there appear to be more blue members hedging towards the warmer side of the mean than the red lines — which is perhaps an indicator of a further warming trend.
The threshold for a strong El Nino is an anomaly of +1.5C or higher, which certainly seems attainable according to the CFS. While not nearly as strong as the 1997-1998 El Nino, it would certainly still be pretty strong, and the fact that the latest members look warmer than the mean indicates that the El Nino could verify warmer than the forecast mean.
Now that we know what an El Nino is, as well as how strong it is forecast to become, let’s examine what causes an El Nino, and what effects it has on our weather pattern.
What causes an El Nino?
Basic: As scientists, meteorologists often love to compare a weather pattern to what is deemed “normal”, so that we can try and isolate some factors that caused these changes. The general atmospheric circulation dictates that the winds in the Equatorial Pacific blow from east to west, which are the easterly trade winds. This tends to push the warmer Equatorial waters to the west, towards Indonesia, and leaves colder water along the coast of Peru. However, when the easterly trade winds either significantly weaken, or even at times shift to the west, that warmer water no longer is forced to the west. It can either stay in the Central Equatorial Pacific (a west-based El Nino), or if there is enough westerly forcing to completely dominate the easterly trade winds, the warmest waters can actually push eastward, all the way towards the coast of Peru. This often happens during the strongest El Nino events, and has major implications on the atmospheric circulation.
Technical: Here is a diagram that illustrates what happens during a normal, non El Nino year.
A schematic of a “normal” year with no El Nino, nor La Nina (NOAA).
The black arrows represent the trade winds, and the shading represents the actual sea surface temperatures in the top image, and the sea surface temperature anomalies in the bottom image. Note how the black arrows are primarily pointing from east to west, indicating easterly trade winds. This pushes the warmer waters to the west towards Indonesia, which leaves cooler water towards Peru. Since this is the “normal” example, the anomalies are neutral. Here is an example of what occurred during the strong El Nino event of 1997-1998.
A schematic of the strong 1997-1998 El Nino (NOAA).
Note how the trade winds have become much weaker, as there is not nearly as much of a defined east to west direction of the arrows. Thus, instead of the warm water being blown to the west, the sea surface temperatures are generally much more uniform throughout the Equatorial Pacific. This becomes reflected strongly in the anomaly chart — notice how the anomaly is oriented west to east with the winds, and strongly positive with the sea surface temperatures. It is not so much that the water is necessarily warmer — it’s just that the typically warm water is now being displaced into an area that usually sees colder water. The further east this warm water can go, the more significant the anomaly, since waters further east are usually colder. This is why the anomaly chart looks extremely impressive to the east, while the mean temperature is not necessarily warmer than areas to the west. Here is an example of what occurs during the counterpart — a La Nina.

A schematic of a strong La Nina event from 1998-1999 (NOAA).
Note how the trade winds are stronger from east to west than they are in the “normal” example, particularly in the Central and Eastern regions. This helps further to blow the warmer water to the west, which creates colder water to the east. This is reflected quite well in the anomaly diagram, with the arrows pointing to the west, and colder colors showing up. It seems relatively simple so far, but this does bear further questions, such as:
1) What causes the trade winds to shift and/or weaken?
2) How can this cause last so long to completely change the normal state of the Equator? How do we know the trade winds will not just strengthen again in a short period of time and shift things back to the way they were?
What essentially happens is that when we get enough westerly forcing and penetration of warmer waters to deeper depths, a certain threshold gets passed, where a feedback cycle begins and warmth overwhelms. This changes the state of the Equatorial Pacific so that even during upwelling events, the water brought up to the surface is still warm, so there is no true period of cooling. We will explain more below.
A major trigger to a weakening of the trade winds and a shifting of the warmer waters is a westerly wind burst. A westerly wind burst can “crash” into the easterly trade winds and weaken them, and push warm water eastward as well. They can often be caused by a Hurricane/Cyclone near the Equator — a Hurricane just south of the Equator will actually have clockwise flow around it (Southern Hemisphere has storms flowing clockwise instead of counterclockwise due to the Coriolis Force), which would actually yield a westerly flow just to its north, or along the Equator.
The 850mb wind anomalies that have recently been observed along the Equatorial Pacific (CPC).
Above, we see a chart of the 850mb wind anomalies, where the red colors indicate a positive anomaly in the west-to-east direction, and the blue colors indicate a negative anomaly in the west-to-east direction, or essentially easterly winds. Note the strong red colors we see in late January, indicating a strong westerly wind burst, and then again notice the even stronger westerly wind burst we had in March. What’s also important is that the second wind burst is slightly east of the first one — indicating an eastward progression. This means that the warm waters are able to be pushed further east with time, which is a classic indicator of a developing El Nino. There even appears to be subtle signs of another westerly wind burst developing now near 180 Degrees, which would further support a developing El Nino. Right at this moment, there is actually a Category 5 Cyclone (Ita) about to hit the Northern Australian Coast, which would further support another strong westerly wind burst.
What’s concerning is that the only other time we have ever seen westerly wind bursts this strong was during the 1997-1998 El Nino, which was the strongest on record. What these westerly wind bursts do is that they initiate what we call an “Oceanic Kelvin Wave.” This is a wave that propagates from west-to-east, and has an area of strong downwelling (warm water being submerged below the surface) and then an area of strong upwelling to balance it out (cold water being brought up from deeper depths to the surface). What initially happens is that to the west, warm water is pushed eastward and then downwelled to the subsurface, warming both the surface and the subsurface waters. However, there is an area of upwelling to its east to balance that out; so initially, while the waters in the Central Equatorial Pacific are getting warmer, the waters near Peru are getting colder.
An image illustrating a typical thermocline — or gradient where the warmer surface waters are separated from the much colder waters at larger depths. The thermocline is much closer to the surface in the Eastern Pacific, which is one reason why Ocean temperatures are often colder in this region (Ocean World).
This process tends to be extremely efficient because of what we call the thermocline, or the area in the ocean that represents the changes between the warmer surface water and the colder waters at large depths. The thermocline tends to be very close to the surface in the Eastern Equatorial Pacific, but at large depths in the Western Equatorial Pacific. Thus, there is often a much more readily available source of cold water to be upwelled further east, but that is not the case further west. However, if enough westerly wind burst progression occurs, the warm water that gets pushed east and downwells will replace the colder water to the east, and change the entire state of the thermocline — making it deeper further east. That way, during any upwelling phase of the Kelvin Wave, the waters being brought up to the surface are still warm. This is what helps to sustain an El Nino event, as opposed to just leading to minor short time-scale fluctuations. Once we see the warmer downwelling waters being pushed very far eastward in association with a strong westerly wind burst, as well as the slope of the thermocline decreasing, that’s when we begin to get concerned about a very strong El Nino.
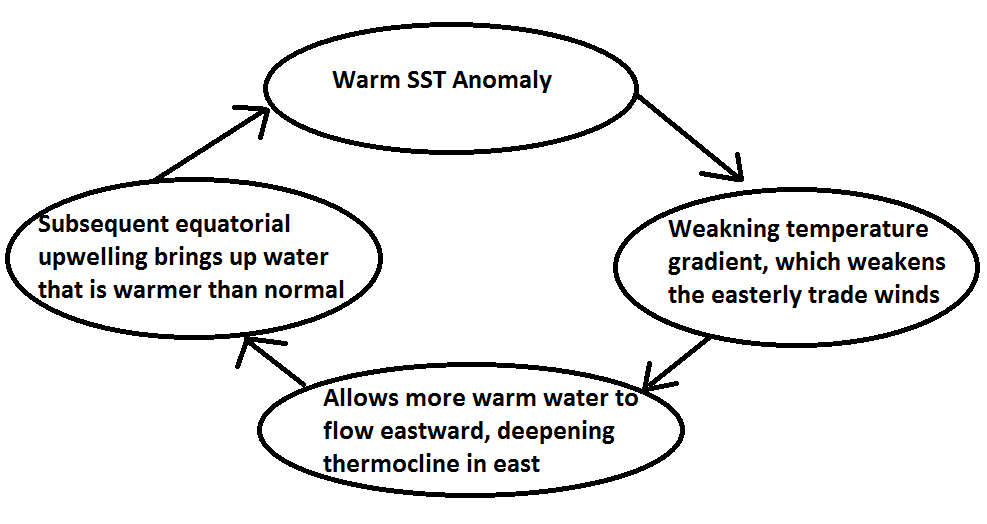
A summary of the Bjerknes feedback hypothesis, which illustrates a strengthening El Nino (J. David Neelin).
There is a major feedback process that goes on as well. An earlier image showed how the warm water becomes much more uniform during a developing El Nino, as opposed to just being relegated to the west and having cold water to the east. If the warm water is much more spread out, the thermal gradient decreases. One of the major reasons why the trade winds get reinforced is because of the gradient to begin with. If all of the warmest water is forced to the west, the surface pressures there are lower, since warmer, moist air has the tendency to rise, which decreases the surface pressure. In order to balance out the rising air and subsequent lowering of surface pressure, air from higher pressure (cold waters to the east where sinking motions are more prevalent) has to flow towards that area. If that thermal gradient is stronger, there is more of an imbalance, meaning the flow of air towards that warmer western water would increase — meaning stronger trade winds. But a weakening of the gradient weakens this imbalance, which weakens the flow towards the west. This serves to slow the trade winds. And as we said before, the trade winds slowing helps more warm water to push eastward to begin with via Kelvin Waves and westerly wind bursts — so this warm water also downwells — and by the time it upwells further east, it is relatively warm, reinforcing the warm SST anomaly that weakened the gradient and weakened the trade winds to begin with. The cycle is continuous, and a feedback is generated.
Let’s take a look at what’s going on right now:
An animation of the current SST anomaly progression in the El Nino regions. Note how the warm anomaly is moving eastward and towards the surface (CPC). You may need to click to animate.
Not surprisingly, because of the westerly wind bursts we have seen and associated Kelvin Waves, we have seen a large warm anomaly of water that downwelled in the Western Equatorial Pacific. Notice how the water towards the east was initially cold — that’s due to upwelling that tends to naturally occur due to a frictional force of the northerly component of the trade winds interacting with the land in South America. It was augmented by the upwelling cycle of the Kelvin Wave downstream of the warming, downwelling cycle. Because of the forward easterly momentum generated by the westerly wind burst, the warm pool is able to efficiently progress eastward. The anomaly becomes stronger with time because that warm pool is entering an area that typically sees colder water. Additionally, because of the downstream upwelling cycle of the Kelvin Wave, as well as the aforementioned natural upwelling, that warm water is also progressing towards the surface. This appears to be the start of the feedback process — the upwelling is now pushing a warm SST anomaly upward towards the surface, as opposed to the cold thermocline waters.
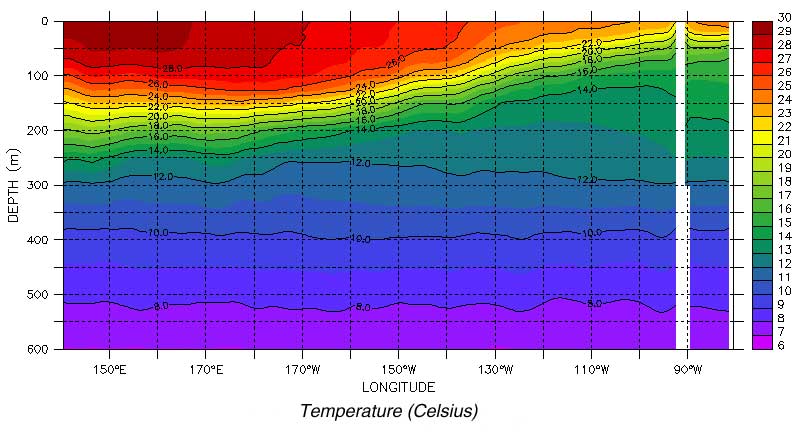
An animation of the actual SSTs, as opposed to the anomaly. Notice how the thermocline is flattening with time (CPC). You may need to click to animate.
The above image is perhaps the most telling regarding the developing El Nino. Look at the initial steep slope of the 20C isotherm — rapidly positively sloped towards the east, indicating a steep thermocline, and thus cold waters very close to the surface. However, as that aforementioned downwelling warm pool progressed eastward, the thermocline rapidly began to decrease, as warm waters have begun to penetrate to much further depths. The thermocline’s slope decreasing means the colder waters typically near the shores of Peru are now much further below sea level — so any upwelling may not be as sufficient in bringing that cold water to the surface. The flattening thermocline is key to really triggering the feedback process and getting a strong El Nino event to progress.
Here is another image that further illustrates this point:
An image showing how much deeper the 20C isotherm is than normal. This indicates a flattening thermocline (CPC).
We previously discussed the deepening of the 20C isotherm and how it relates to a flattening thermocline — the above image now shows the anomaly — meaning how much deeper the 20C isotherm is compared to normal. The previous westerly wind bursts and Kelvin Wave were able to downwell the 20C isotherm somewhat deeply, but it was not enough to truly change the slope of the thermocline, as the upwelling cycle that immediately followed was able to push the colder water back to the surface in those same areas. However, this time around, the 20C isotherm has plunged to much deeper depths and has been able to do so further east, illustrated by the solid black lines drawn — significant anomalies have progressed eastward. Also notice to the west that the 20C isotherm is actually slightly more shallow than normal, which further indicates a flattening thermocline! This tells us that the initial westerly wind bursts tried to change the state of the equator, but were unable to do so since the cold water held on — not enough warm water was able to penetrate deeply enough to erode the colder Eastern Pacific waters. But after enough persistence, and an increase of strength with each downwelling cycle with time, the threshold bubble finally popped, and the entire state of the Equator has begun to completely change. This makes us confident in a developing Strong El Nino.
What does this mean for our weather?
More warm water being evenly distributed along the Equatorial Pacific means that the area of warm, moist air that is forced to rise expands eastward. This change in orientation of the rising air disrupts the normal atmospheric flow. For example, the increased rising air tends to expand the column of air as well, which helps to create an upper level ridge of higher pressure. The clockwise flow around this upper level ridge of higher pressure leads to an increase of westerly winds to the north of it, which strengthens the Pacific jet stream and extends it further to the east.
Effects on our Weather:
1) The strong Pacific jet stream tends to be able to penetrate all the way to the Atlantic. This jet stream blows the tops off of hurricanes, and makes it harder for them to develop. This leads to a potentially less active Atlantic hurricane season.
2) The jet stream being stronger also makes it less wavy, so it remains further south. This tends to shift the tornado season further south, since unlike hurricanes, tornadoes thrive off of upper-level wind shear from a jet stream.
3) Cooler summers in the United States; particularly the Northeast. Our summers are also often wetter (2009 is a good example).
Temperature correlation composite ran from June through August with Nino region 3.4. Notice the negative correlation — that means the higher (warmer) Nino 3.4 is, the colder our temperatures are (NCAR).
4) Much wetter fall and winter seasons in all of the Southern States, particularly Southern California, as the displaced Pacific Jet Stream plows into the Southwest, which increases the moisture feed into that area. Once the jet stream interacts with the Gulf of Mexico, precipitation blossoms in the Southeast as well.
5) The strong and less wavy Pacific jet stream is not able to penetrate as far northward and displace cold, Arctic air southward. This tends to lead to warmer winters in the Northern Latitudes, particularly the Northern Plains.
6) The strong Pacific Jet stream’s ability to bring unsettled weather also makes things colder in the Southern States as well, relative to normal.
7) If the El Nino is strong enough and based to the east (as is potentially expected), the warm Northern Plains weather could easily expand to our area (East/Northeastern US) for the upcoming winter. However, with the increasingly active storm track to the south with all of that moisture, any potential episode of cold air that we do get and/or a blocking pattern to the north leads to the increased potential of a major snowstorm or blizzard, if that moisture were to come up the coast (The Blizzard of 1983 occurred during a Strong El Nino). That being said, given the presence of warmer air just to the west and potentially much less Arctic air available than last winter, there is also the chance of a snowless winter with just a lot of southern jet-stream induced rain storms/nor’easters, with snow confined well into the interior (This is what happened during the Strong El Nino of 1997-1998).
Temperature correlation composite ran from December through February with Nino region 3.4. (NCAR).
As noted in the composite, the warm temperatures do not always make it to the east, which makes our Northeast winter temperatures a bit uncertain. This is why we made the previous statement that if the El Nino is strong enough and based to the east, our winter temperatures could be warmer, since those anomalies could also expand eastward. This also means that if there is a stronger west-based El Nino, the warmer temperatures tend to stay further west, yet the active storm track can still remain — that is when we have our snowiest winters (2009-2010 was a classic west-based El Nino). However, the extremely strong El Ninos tend to be based further east, since they tend to have the weakest trade winds over the entire Equatorial Pacific, and allow for more warm water to progress eastward. Regardless, the strong El Nino generally signals less frequent Arctic outbreaks, so next winter should not be as cold as this past winter.
As far as global impacts are concerned, the increased warm water further east along the Equatorial Pacific tends to bring flooding rains to Peru and Ecuador, and less warm water further west tends to lead to major drought in areas such as Indonesia and Australia. Additionally, fisheries along Peru and Ecuador are significantly affected, since lots of nutrients tend to exist in the colder waters that are upwelled. But if those colder waters can never be upwelled with the less steep thermocline, then those nutrients can never be brought up to the shores. Additionally, more warm water being spread out over a larger area means that more heat gets added to the atmospheric circulations, increasing the global temperatures. If the El Nino reaches its potential, 2015 could be the warmest year on record.
This post was compiled by Doug Simonian and John Homenuk. Feel free to shoot us an email at nymetroweather@gmail.com if you have any further questions, or comment on our Facebook and Twitter Pages. We’ll conclude by listing the valuable sources which helped contribute to this research, including the excellent work by Dr. Michael Ventrice.
Sources:
1) http://www.wunderground.com/blog/JeffMasters/comment.html?entrynum=2635
2) http://www.pmel.noaa.gov/tao/elnino/el-nino-story.html
3) http://www.slate.com/blogs/future_tense/2014/04/07/el_nino_2014_2015_forecasts_show_it_could_grow_into_a_monster.html
4) http://cobblab.blogspot.com/2014/03/all-eyes-on-tropical-pacific.html
5) http://www.cpc.ncep.noaa.gov/products/precip/CWlink/MJO/enso.shtml#discussion
6) Climate Change and Climate Modeling by J. David Neelin
7) Composites were made from here: http://www.esrl.noaa.gov/psd/data/correlation/
This was beautiful Admin. Thank you for your reflections.
This is my first time pay a quick visit at here and i am really happy to read everthing at one place
I very delighted to find this internet site on bing, just what I was searching for as well saved to fav
This was beautiful Admin. Thank you for your reflections.
naturally like your web site however you need to take a look at the spelling on several of your posts. A number of them are rife with spelling problems and I find it very bothersome to tell the truth on the other hand I will surely come again again.
This was beautiful Admin. Thank you for your reflections.
There is definately a lot to find out about this subject. I like all the points you made
very informative articles or reviews at this time.
son dakika adana haberleri
I very delighted to find this internet site on bing, just what I was searching for as well saved to fav
very informative articles or reviews at this time.
I like the efforts you have put in this, regards for all the great content.
This is my first time pay a quick visit at here and i am really happy to read everthing at one place
I am truly thankful to the owner of this web site who has shared this fantastic piece of writing at at this place.
Great information shared.. really enjoyed reading this post thank you author for sharing this post .. appreciated
son dakika samsun haberleri
Very well presented. Every quote was awesome and thanks for sharing the content. Keep sharing and keep motivating others.
I appreciate you sharing this blog post. Thanks Again. Cool.
I very delighted to find this internet site on bing, just what I was searching for as well saved to fav
I really like reading through a post that can make men and women think. Also, thank you for allowing me to comment!
I appreciate you sharing this blog post. Thanks Again. Cool.
Great information shared.. really enjoyed reading this post thank you author for sharing this post .. appreciated
Awesome! Its genuinely remarkable post, I have got much clear idea regarding from this post
Awesome! Its genuinely remarkable post, I have got much clear idea regarding from this post
very informative articles or reviews at this time.
This is my first time pay a quick visit at here and i am really happy to read everthing at one place
I just like the helpful information you provide in your articles
son dakika yozgat haberleri
son dakika ordu haberleri
Unquestionably believe that which you stated. Your favourite justification seemed to be
on the web the easiest factor to understand of. I say
to you, I definitely get annoyed even as other people think about
concerns that they just do not realize about. You controlled to hit the nail upon the highest as neatly as defined out the whole thing with no need
side effect , folks can take a signal. Will likely be again to get more.
Thanks
son dakika malatya haberleri
son dakika sirnak haberleri
I really like your blog.. very nice colors & theme.
Did you make this website yourself or did you hire someone to do
it for you? Plz reply as I’m looking to design my own blog and would like to know where u got this from.
thank you
Write more, thats all I have to say. Literally, it seems as though you relied on the video to
make your point. You obviously know what youre talking
about, why waste your intelligence on just posting videos to your weblog when you could be giving us something enlightening
to read?
Very nice article, just what I needed.
Hackdra is a cyber security company that can provide smart contract auditing, pen-testing, bug bounty, blockchain, web3, DeFi, NFT, and ARM services with AI.
chia tohumu faydaları
chia tohumu
chia tohumu faydaları
En güvenilir zingabet giriş sitesine yeni güncel giriş tıkla.