-2")
The PDO, MJO and Their Potential Influence In This Upcoming El Nino Winter
When a forecaster makes a seasonal outlook or forecast, he/she must consider all possible climate drivers and variables with teleconnections. Previous articles such as Monitoring the Stratosphere and The Importance of High Latitude Blocking in Upcoming Winter discussed the variables that were considered for our winter forecast, and how much weight was put into each. Now it’s time to look at some other climate patterns in Pacific. For example, this year’s strong El Nino is something you probably have heard the most about.
There is little doubt that a strong El Nino has a large influence over the atmospheric pattern in the Pacific Basin. Some have used the term “Godzilla El Nino” to describe this year’s phenomenon; which, while catchy, could perhaps be unneeded sensationalism. Another common thought is that after 1997-98 — the last “Super” El Nino, which was an extremely warm and snowless winter — that this winter will also be very warm and snowless in the Northeast. However, there are other climate patterns in the Pacific that can still have influence, even in the midst of such a strong El Nino, which makes such strongly-worded conclusions about this winter not justified.
One of those climate phenomena is The Pacific Dedcadal Oscillation (PDO). The PDO is the configuration of the North Pacific sea-surface temperature anomalies that oscillates in an interval of years between warm and cold phases. It primarily influences the atmospheric patterns over the Pacific Basin and North America.
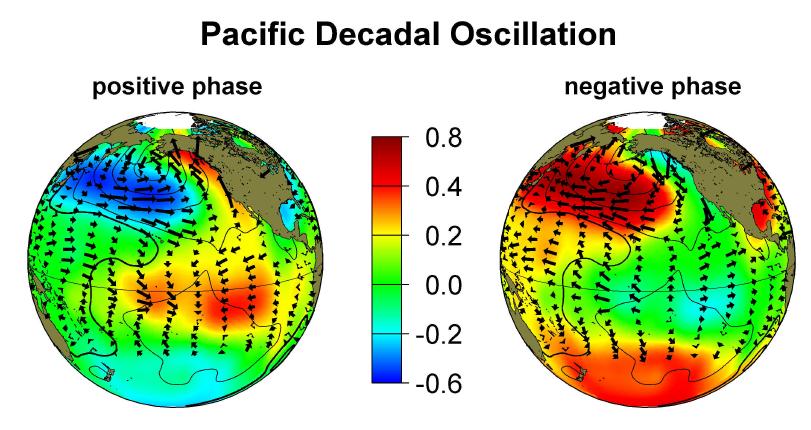
Pacific SST anomalies during warm (positive) phase and cold (negative) phase of the PDO. Image courtesy of JISAO
As seen in the above image, the warm phase (+PDO), typically consists of warmer than normal sea-surface temperatures (SST) that stretch from the Gulf of Alaska down to the California coast, whereas we have colder than normal sea-surface temperature further west through the Central and Western Pacific. This phase typically supports -EPO/+PNA patterns over North America with a deep low near the Aleutian Islands, leading to a downstream ridge in NW Canada and the Western half of the US. The cold phase (-PDO) typically consists of cooler than normal SSTs over the Gulf of Alaska through the California coast and warmer than normal SSTs further west through the Central and Western Pacific. This phase typically supports +EPO/-PNA patterns over North America with a deep low positioned further east over the Gulf of Alaska.
500mb height anomalies for +PDO phase during past winters.
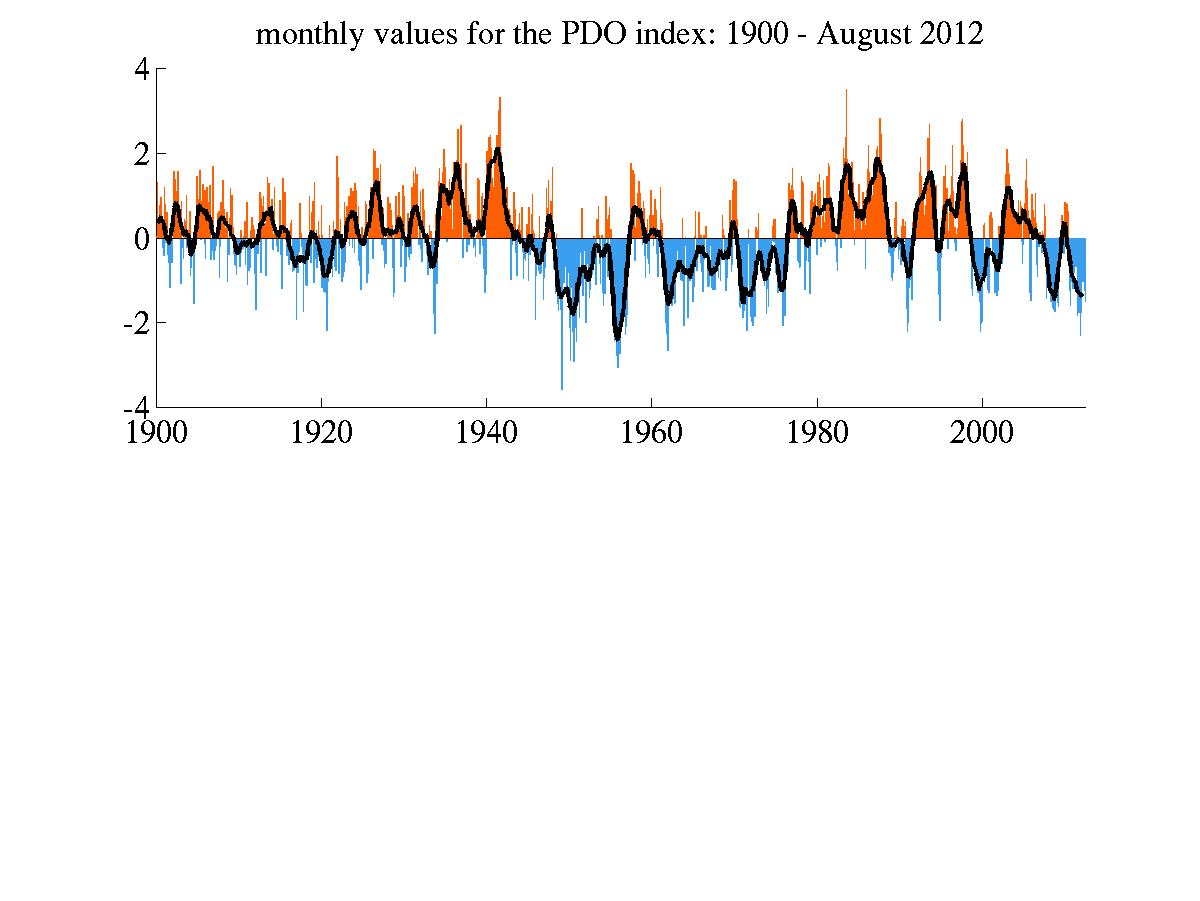
Sometimes there is just warm pool of SST anomalies over NE Pacific or Gulf of Alaska, without the cold water further west. This leads to a +PDO, but with values less than +1.00 — the PDO is measured by the gradient between the cold SST anomalies over the Central and Western Pacific, and the warm SST anomalies half-circling around it closer to the West Coast of North America.
This warm pool appears to still have a big influence on the Pacific pattern, despite the fact that the Tropics often primarily drive the weather pattern. In the 2013-14 winter, we had a plethora of Arctic airmasses and significant snowstorms, primarily driven by a strong -EPO phase that coincided with a warm pool anomaly over the Northeast Pacific. Since then, the warm pool shrank somewhat (though it still hung around last winter and helped drive even more severe cold), as some colder SST anomalies formed over the Central-North Pacific.
Some media sources have referred to this warm pool as a “blob”. To many experienced weather forecasters and hobbyists, we just know it as the +PDO (albeit a pretty strong manifestation of one). This is a normal climate pattern that has been recorded as far back as 1900.
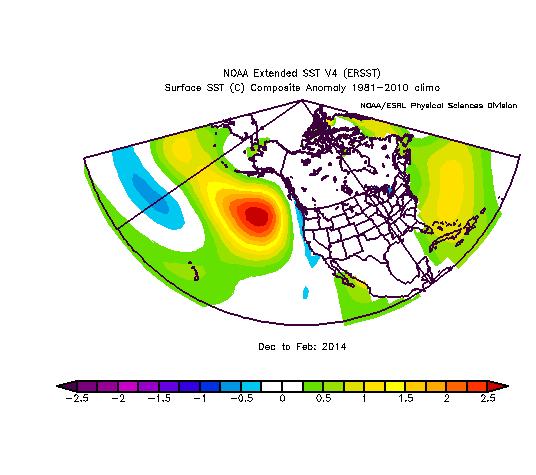
Warm pool anomaly of sea-surface temperatures over the NE Pacific in December 2013 to February 2014
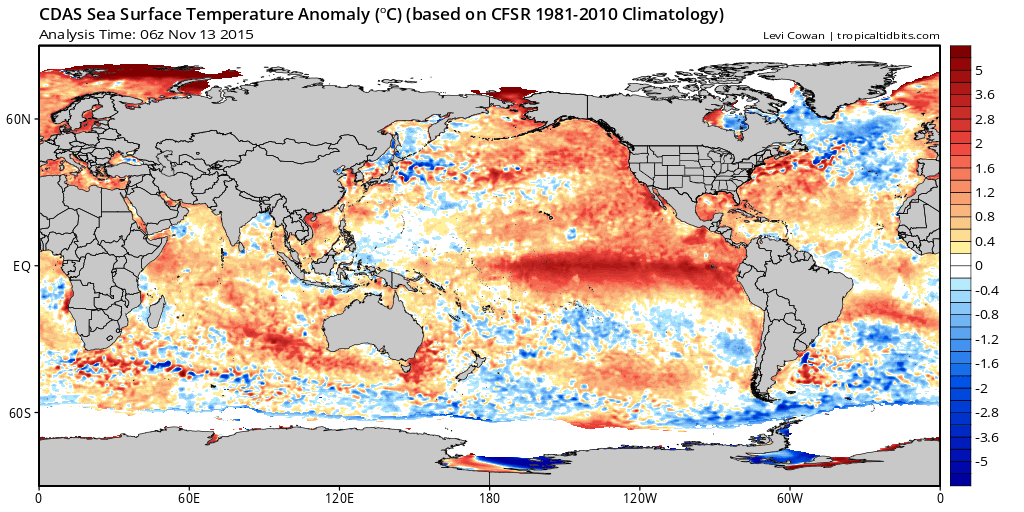
We continue to be in a warm/positive phase with monthly +PDO values from JISAO exceeding 1.00 or 2.00 in every month since September 2014. The latest value for October 2015 is 1.47. Our most reliable seasonal models forecast the +PDO to continue through the winter.
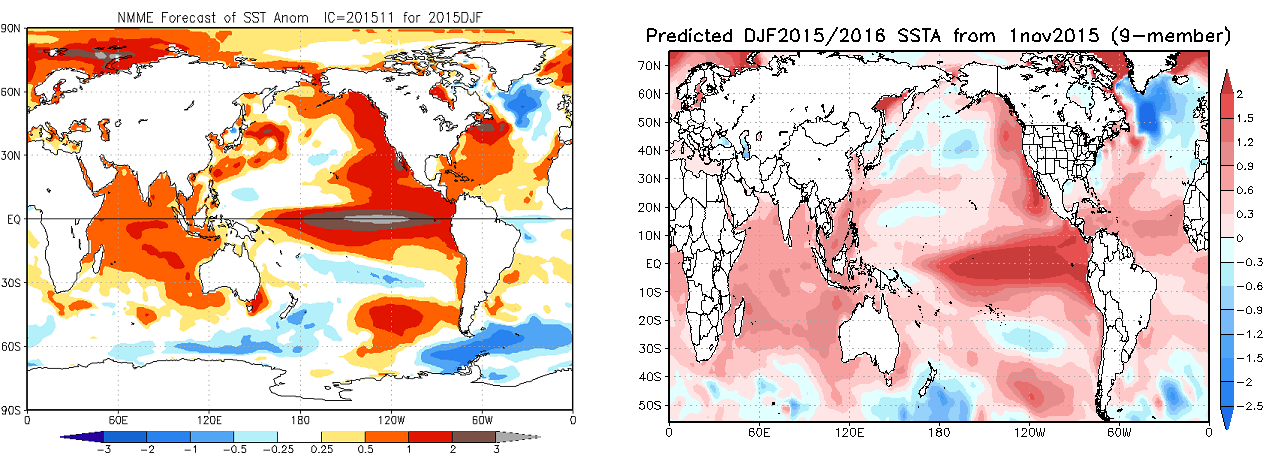
NMME (left) and JAMESTC (right) show warmer than normal SSTs over Northeast Pacific with El Nino for DJF
Another climate phenomena is the Madden-Julian Oscillation (MJO). This is a wave of enhanced convection in tropics that typically propagates eastward from out of the Indian Ocean to the coast of Peru. How much influence the MJO has often depends on the amplitude or speed through each phase. This can be observed on phase plots of the MJO index forecasts from several models. In general phases 7, 8, 1, and 2 favor more cold air and winter storms for the East Coast. In general phases 3, 4, 5 and 6 favor warmer and drier weather for the East Coast.
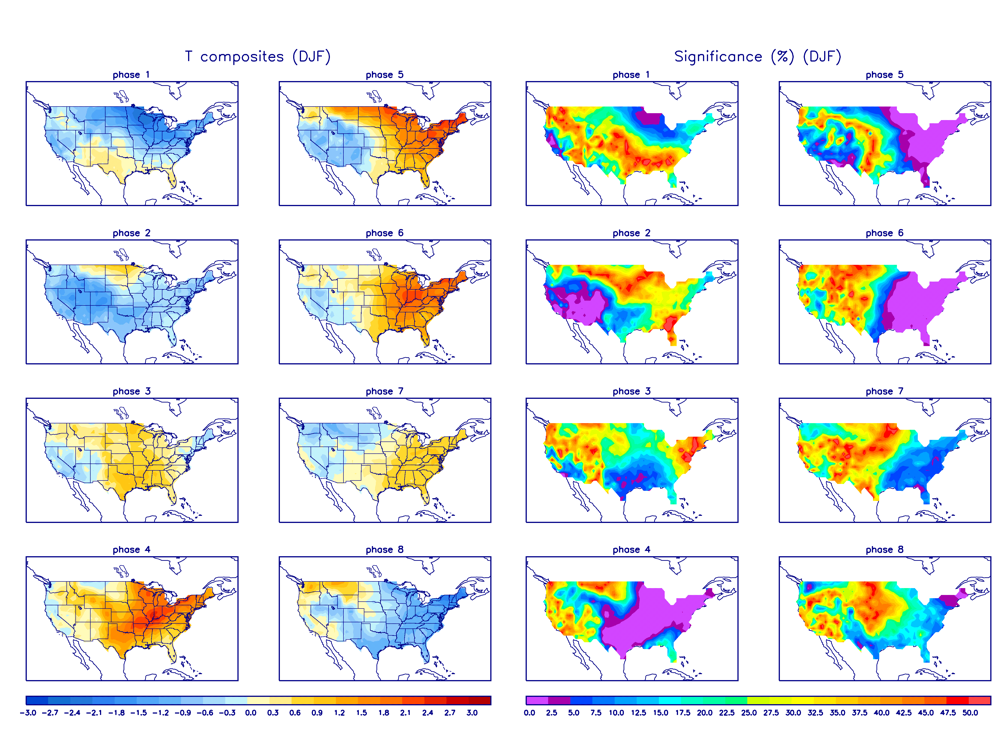
Temperature anomalies for each phase of MJO during December, January and February (Image courtesy of CPC)
Sometimes the MJO signal is incoherent and is not easily distinct to identity in the tropics. We often refer to this as just tropical forcing. This could mean that while convection associated with lower-level convergence is near the Dateline, the upper-level divergence could be in another area, usually associated with a strong upper-level jet. These composites show the MJO phases when observed through 850mb Outgoing Longwave Radiation (OLR) anomalies and 200mb Velocity Potential anomalies over the Tropical Pacific. These indicate tropical forcing in the lower and upper levels of the atmosphere.
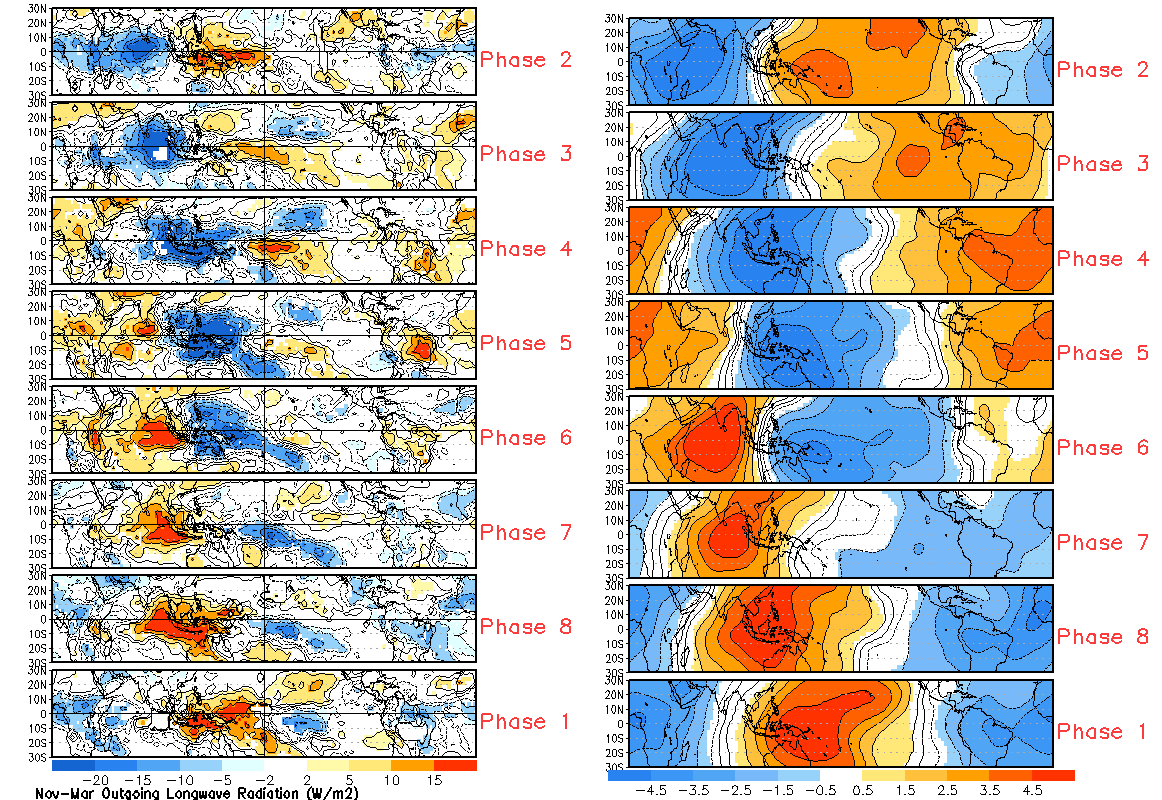
A general composite for Outgoing Longwave Radiation (left side) and 200mb Velocity Potential (right side) anomalies in the Paicific for each MJO phase. (Images courtesy of CPC)
A major index that indicates the amount of El Nino’s influence on the atmospheric pattern is the Southern Oscillation Index. This is the difference in sea-level pressure between the Central and Western Pacific. During El Nino, above normal pressures are over Indonesia and the western tropical Pacific, whereas below normal pressures are over the eastern tropical Pacific. This tells us how much El Nino is influencing or driving the atmospheric pattern in the Pacific Basin. A higher negative value is more indicates more influence. The October SOI came an -20.2. This value is the third highest (most negative) October SOI. Only 1982 and 1941 had more negative October SOIs, as both were -20.5. For comparison, October, 1997 had a SOI value of -16.7.
Only five other El Nino periods had higher negative SOI values (credit: Tom Stavola)
-29.4 in 1940-41
-22.6 in 1965-66
-33.3 in 1982-83
-28.5 in 1997-98
The Walker Circulation (Walker Cell for short) is a body of trade winds in the atmosphere that circle from west to east in the low-levels and east to west in the high-levels, during a Strong El Nino. This circulation would eventually bring a warm pool of SSTs further east and cause more convection triggered by forcing over the central and eastern tropical Pacific (credit: Anthony Maseillo. Source for more info: https://www.climate.gov/news-features/blogs/enso/walker-circulation-ensos-atmospheric-buddy).
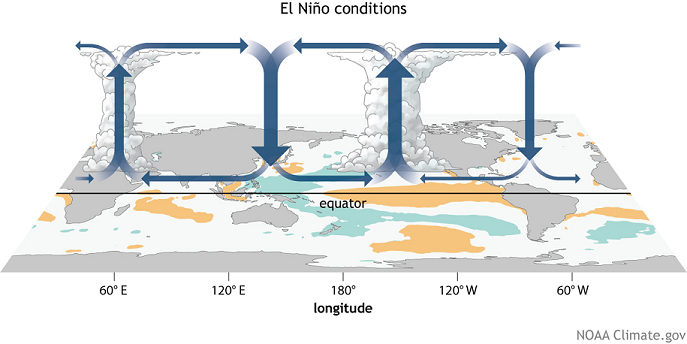
Walker Circulation during El Nino conditions. Rising air (tropical forcing) with convection between 180° and 120°W
Different types of El Nino are usually characterized by the mean strength and position of those sea-surface temperature (SST) anomalies in the Pacific.
An east-based El Nino in general has the warmest sea-surface temperature anomalies between 90W and 120W in the Tropical Pacific. The warmest ENSO regions tend to be 1+2 and 3.0. The El Nino for 1997-98 was extremely east-based with the warmest SST near Ecuador and Peru for most of its cycle. 1982-83 was not quite as east-based for its cycle, but it was still an East-based El Nino.
An El Nino Modoki (Modoki means similar, but different, in Japanese) is a special term for an El Nino with the warmest SST anomalies focused in a pool over the Central Pacific from around 150W to around 160E. There are also cool SST anomalies off the coast of Ecuador and Peru and Near Indonesia. This term however, is often used more loosely when an El Nino has its warmest SST anomalies wast of 140W, even if it doesn’t meet the other criteria exactly.
Modoki El Nino in the Tropical Pacific. Image Credit: JAMESTC
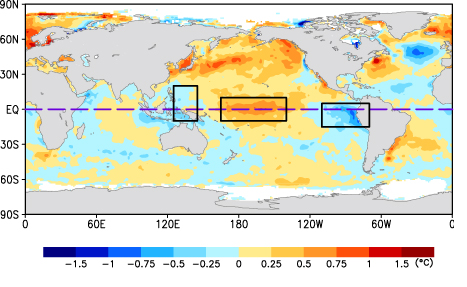
A basin-wide El Nino has a more expansive area of warm SST anomalies, as their warmest SST anomalies extend more from around 120W to around 150W in the Tropical Pacific. The El Nino this year is best characterized as strong basin-wide event, as the warmest anomalies have been more expansive between 90W and 150W. The warmest SST departures have been in ENSO regions 3 and 3.4. While the anomalies are not as high in region 4, we’ve still hit the highest ENSO region 4 temperature ever recorded — making this El Nino truly a unique beast as very warm waters are dominating the entire Equatorial Pacific. Additionally, the SST anomalies have been warm in the Northeast Pacific.
Another aspect to consider here is where tropical forcing lies for the majority of this El Nino. This being a strong basin-wide event gives this event slightly more levels of forcing, with more diffuse SST gradients and areas of latent heat release. Therefore, we see convection more spread out through the Tropical Pacific. One way to identify the location of the forcing is from the use of Outgoing Longwave Radiation (OLR) products. Clouds and precipitation from convection prevent radiation from escaping back into outer space. Thus, a low or negative OLR anomaly indicates where the convection and tropical forcing is.
7-Day Average OLR indicating low-level forcing just east of dateline.
In the last week of October, a shift east into the Eastern Pacific with the bulk of tropical forcing occurred with the MJO wave propagating over the very warm SST anomaly off Southwest Mexico. Note that is also contributed to Hurricane Patrica becoming the strongest hurricane on record in the Western Hemisphere. Current OLR anomalies indicate more convection and tropical forcing has returned to just east of the Dateline in the past week, while a weaker, diffuse area of OLR anomalies remain elongated into the Eastern Pacific. But the strongest convection and tropical forcing is now over more parts of the Central Pacific. This resembles tropical forcing with the basin-wide events.
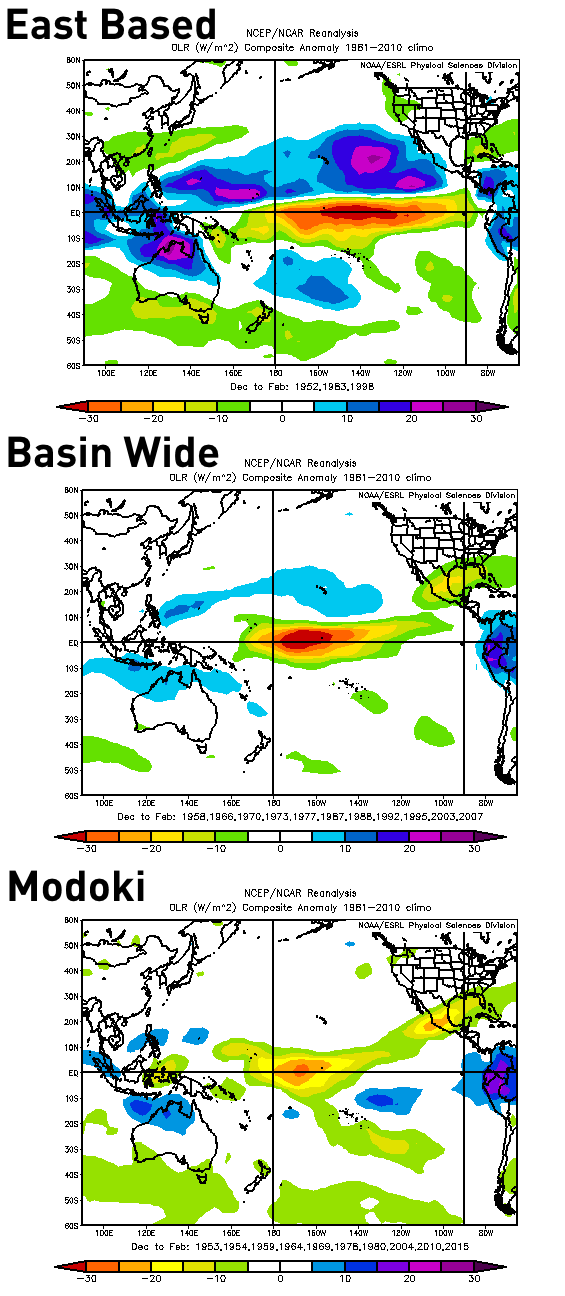
Tropical forcing viewed through OLR anomalies for East-based, Basin-wide, Modoki events. Image and research credit: Ohweather from Americawx forums
Our most reliable seasonal forecast models also appear to support stronger convection and tropical forcing centered near the Dateline, with weaker convection and tropical forcing elongated further east in the Eastern Pacific. The record warmth in Nino region 4 could also help to support stronger convection centered near the Dateline.
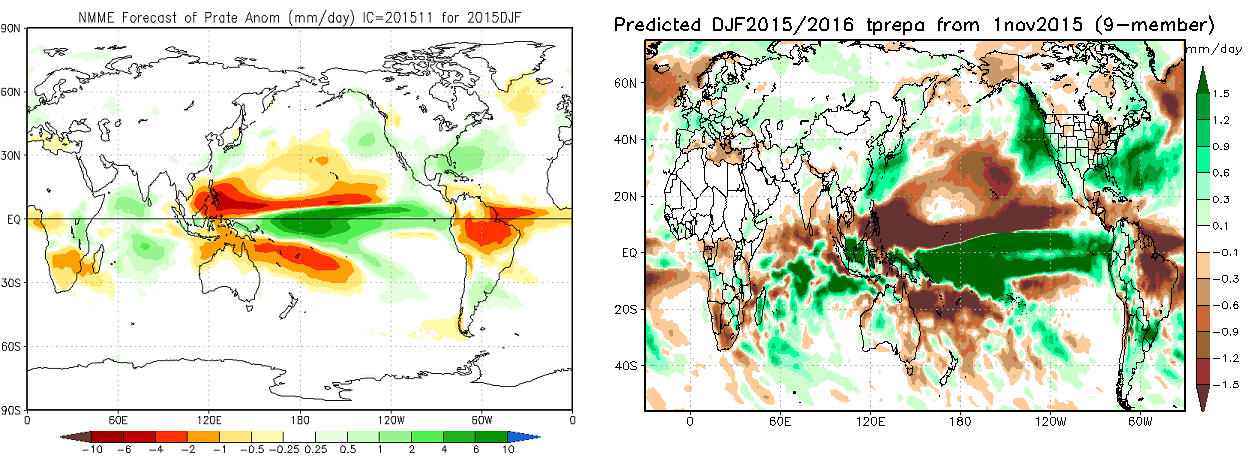
Seasonal-range models showing high precip rates in the near the dateline. NMME model show on the left. JAMESTC model on the right.
When El Nino peaks in intensity is also very important to the winter weather in the Northeast US. The five strongest past El Ninos had a double peak in intensity. The ones that had a double peak in the late Autumn and in the early-middle Winter generally featured warmer than average temperatures and below normal snowfall for the winter in the Northeast US. These El Nino events remained at a strong level in January, which makes it more difficult for a pattern change to colder and snowier conditions to occur in the middle of winter.
Multivariate ENSO Index (MEI) is another way to measure the El Nino conditions through air and sea-surface pressure, temperatures, and zonal winds. The Sept-Oct MEI just came at 2.225, which is between the Sept-Oct 1982 and Sept-Oct 1997 MEI numbers of 2.019 and 2.417, respectively. The value from the CPC for ENSO region 3.4 was 2.8 this week, which is the highest value on record for that region since the 1997-98 El Nino. Current observations and models indicate that the El Nino will probably strengthen for another few weeks with SST anomalies increasing in the 3.4 region. The CFS (image below) now forecasts the Nino to probably peak in December, which is average with past El Nino peaks in intensity. However, we believe it’s unlikely that this El Nino will be as strong as 1997-98 in the tri-monthly ONI values.
CFS ensemble mean showing Nino region 3.4 peaking and plateauing in December
Nino Region 3.4 is on-par with 1997-98 in strength, but it doesn’t appear to be nearly as east-based as 1997-98. This is because region 1+2 near South America coast is running cooler than other regions further west. This the opposite of what we saw during 1997-98. An east-based nino typically the enhances a faster, zonal flow out of the Pacific with a large low positioned over the Gulf of Alaska. This results in most of the Untied States being flooded with mild Pacific air. That winter was basically mild and snowless for Tri-State area.
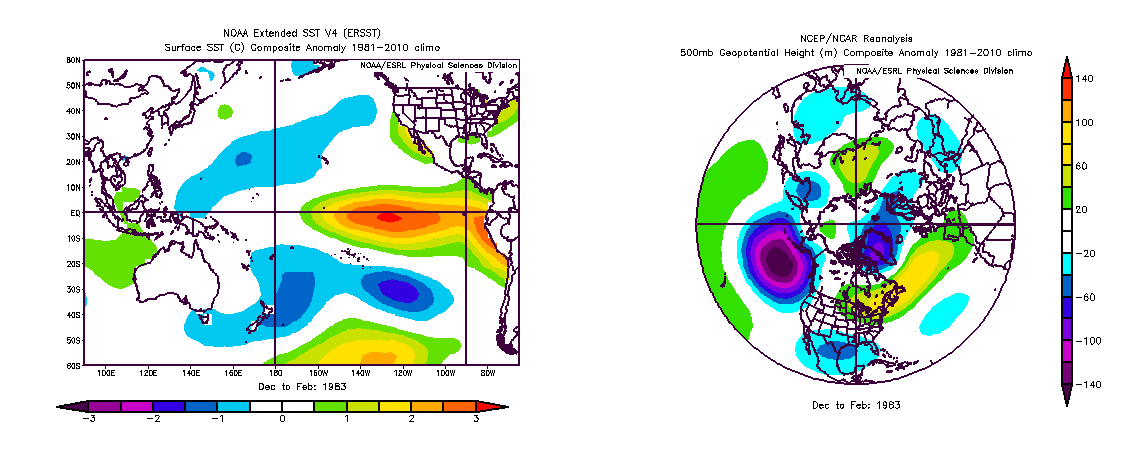
Latent heat release from the 26C+ degree water in the Tropical Pacific usually has the most influence on the atmospheric pattern over the Pacific, which is why El Nino is so important. That being said, the warmer than normal SSTs in the North Pacific may have still have some influence. The 1982-83 El Nino was very strong but not as east-based as 97-98. North Pacific sea-surface temperatures were not as warm during 1982-83 El Nino as they are now, although +PDO did rise in February up to 1.14.
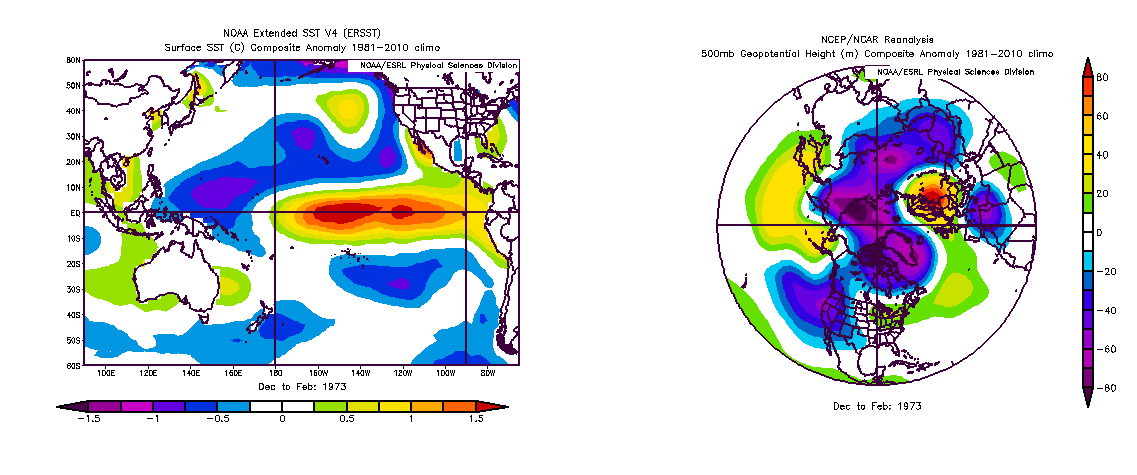
The 1972-73 was another strong El Nino, but had an usual coupling with a weak -PDO and an overall cooler North Pacific. That winter featured a mostly +AO, +NAO and -PNA, with warmer than normal temperatures and below normal snowfall on average. This is the winter with least snowfall for Central Park, NY at just 2.8″.
The 1957-58 El Nino was much more central-based. It had actually PDO values that were closer to neutral. However, the SSTs in the Gulf of Alaska region were still above normal. That winter produced a warm December on average for our area. Then high-latitude blocking increased, leading to a colder pattern in January, February and March. There were two major snowstorms for NYC metro in February and March that was previously mentioned in The Importance of High Latitude Blocking in Upcoming Winter.
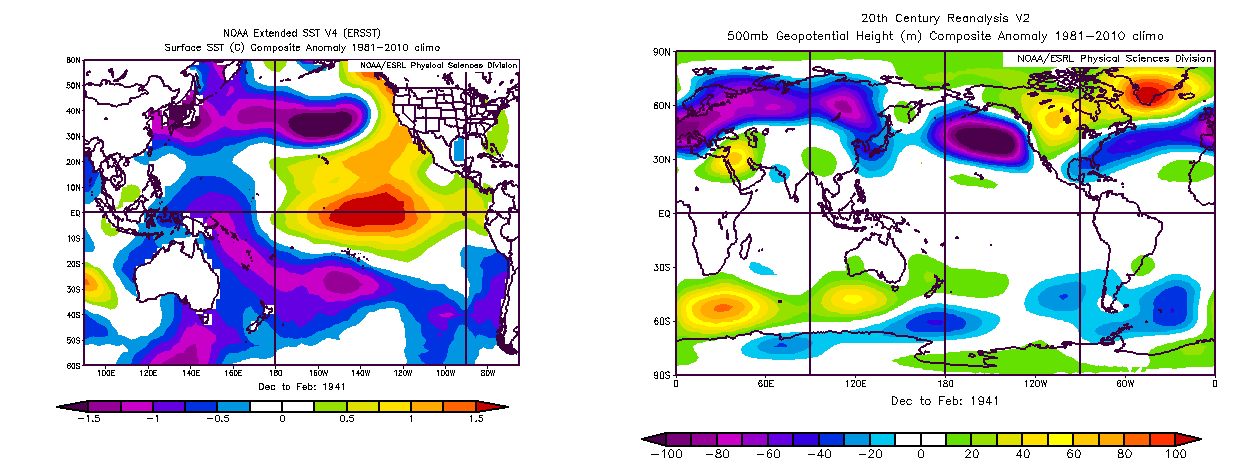
 1940-41 was a basin-wide El Nino with a strong +PDO values greater than 1.00 . This also featured a warmer than normal December for the Tri-State area. High-latitude blocking — including a Greenland -NAO — increased in January, February, and March, leading to colder than normal conditions and several bouts of snow. The biggest snowstorm occurred on March 4-7 for the DC-BOS corridor, when NYC received 18.1″ of snow. However, despite being a close match with its +ENSO and +PDO conditions, that year also featured a colder than November for much of the CONUS with a -EPO pattern, which is not likely to occur for this November on average. This gives us slight pause in using it as a primary analog for this year, but we still like 1940-1941 as an analog overall.
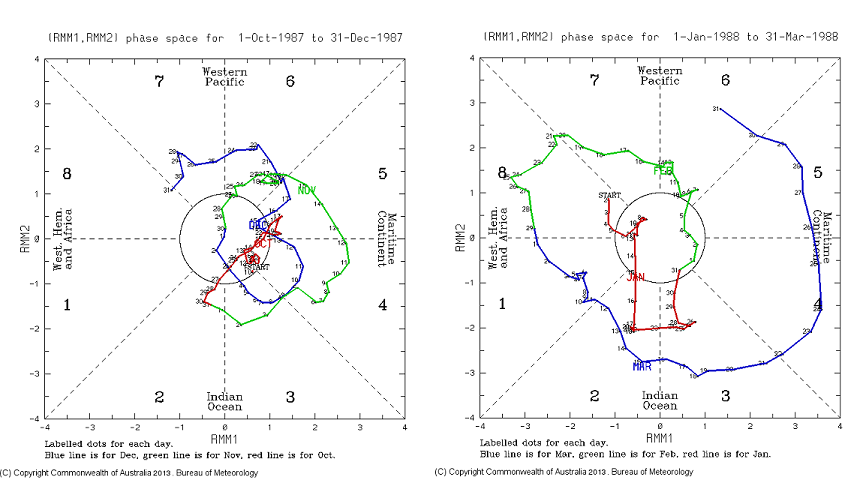
During the 1987-88 moderate El Nino, the MJO propagated strongly through most of phases during OND (October, November, December) period. This was an indication of more variant tropical forcing that one would typically expect from an El Nino. This winter was active and featured an early season snowstorm on Veteran’s Day in 1987 for parts of Mid-Atlantic and New England. Unlike 1957-1958 and 1940-1941, this winter didn’t feature much high-latitude blocking. Central Park,NY and Philadelphia, PA saw below normal snowfall, while Washington, DC and Boston, MA saw above normal snowfall.
During the 2009-10 moderate (Modoki) El Nino, the MJO propagated through all of the phases as well, helping to cause high-latitude blocking for parts of this winter. This combination resulted in a colder than normal December and February and well-above normal snowfall for much of the Northeast US. The largest winter storm event that season was with the blizzard of December 19, 2009 that impacted major I-95 cities from Washington, DC through Boston, MA. 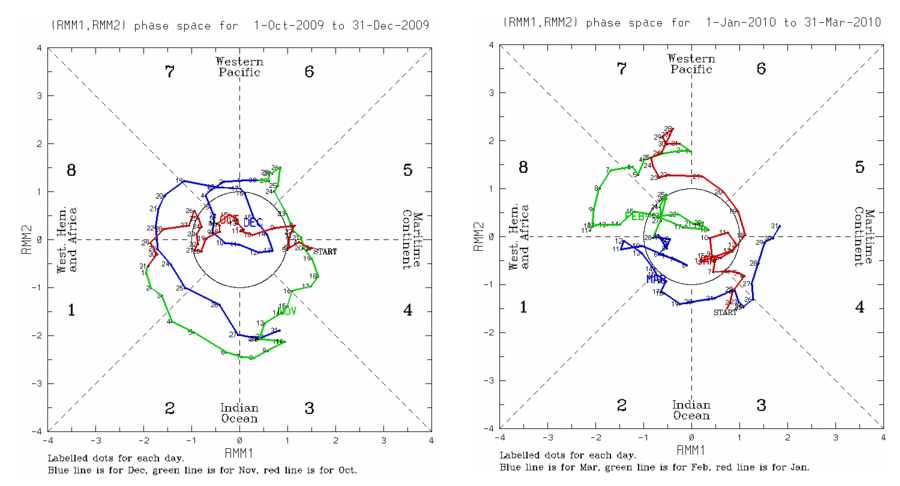
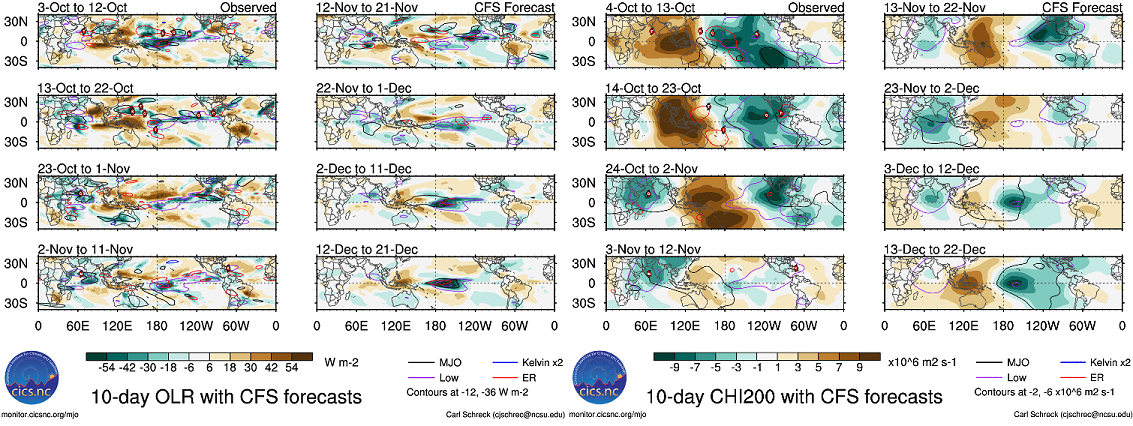
The CFS model indicates that 850mb anomalies and 200mb velocity potential anomalies will be around and just east of the Dateline in December. This could mean a more coherent MJO wave may be developing, which may lead to enhanced wave activity flux and thus lead to a breakdown of the stratospheric polar vortex sometime in January.
Overall, we expect more volatility in the atmospheric pattern over the Pacific and North America than what we would normally expect with a very strong El Nino. Our forecast is based on monthly means and hedges more on the +ENSO and +QBO analogs, which support more cold and snow during the mid-late winter. The warmer SSTs in North Pacific will support periods of a -EPO, but not likely as robust as last two winters. A Gulf of Alaska Low and/or a fast Pacific jet is more common during Strong El Nino, especially in December. By February, the low shifts further west to near the Aleutians. So a winter that features many Arctic blasts, like the previous two winters is not anticipated.
But stronger Rossby waves are likely to develop with strong tropical forcing near the Dateline. The +PDO could enhance a ridge Northeast Pacific region, supporting a more meridonal flow over the CONUS. There could be a trough digging into the Southwest US, thus building a strong southeast ridge with very mild temperatures for our region for days. Then as the pattern progresses east, a storm system with a variety of weather impacts and colder temperatures behind it may follow.
The warmer than normal Indian Ocean should enhance convection in that vicinity. Any waves of convection that propagate out of Indian Ocean and across the Tropical Pacific should be more associated with the El Nino Walker Circulation. But the influences could be similar to what is common in each of the MJO phases. On the other hand, if the MJO is incoherent and not propagating through the all phases, it could be an indication that +ENSO conditions are very strong and is by far the primary driver of the atmospheric pattern for this winter.
This article is was compiled by Miguel Pierre, with collaboration from John Homenuk and Doug Simonian
Trackbacks & Pingbacks
3ambulance
Comments are closed.