-2")
From Strong El Nino to Strong La Nina?
Over the past few months, we have had an El Nino. In fact, it has been one of the strongest El Ninos on record, and is one of the reasons why this past winter was generally quite warm, and why the Pacific Jet stream was so fast and active. It also helped to trigger the historic blizzard we had on January 22nd-23rd. Currently, while we still have an El Nino at the surface, conditions are rapidly flipping towards La Nina when one takes a deeper look at the oceans, as well as the trends in the climate models.
Under “normal” conditions, where there is no El Nino nor a La Nina, the trade winds are persistent in the Equatorial Pacific, which generally blow from east to west. This “pushes” the warmest Equatorial waters further west towards Australia and Indonesia, leaving cooler waters in their wake with more upwelling of subsurface cool water as well. Over the past year or so, these trade winds rapidly weakened and even reversed in some areas, allowing warm water to flow back eastward (instead of getting forced westward) towards the entire Equatorial Pacific, spreading eastward towards Peru. As warmer water builds, Oceanic Kelvin waves, which move from west to east — but also move up (upwelling) and down (downwelling) to transport warm or cool water vertically — are able to push warm water to strong depths and generate “pools” of warm water. This allows an El Nino to sustain itself, as even when a brief period of trade wind acceleration takes place and more upwelling happens, the water upwelled is still warm. It can take months to fully reserve a new El Nino equilibrium.
But finally, the proverbial rubber band is snapping.
- The trade winds appear to be re-surging.
In the Autumn of 2015, the Super El Nino was peaking, which was a byproduct of weakened trade winds, and even a reversal from west to east, via westerly wind bursts. The image below shows this nicely, with generally very weak east to west ocean currents, with most areas between 180 and 140W actually having strong east to west current — the opposite direction of the prevailing trade winds, which allowed warm water to spread eastward.

Recent analysis of the Ocean surface currents in the Tropical Pacific show that the Trade Winds have reversed back to their prevailing direction. (OSCAR)
But notice when we now move forward to the most recent analysis, the trade winds are much stronger across the whole Equatorial Pacific, which allows warmer water to get pushed back westward, and get replaced by cooler waters. In fact, the 180 to 140W region has essentially the exact opposite ocean currents that they had when our El Nino event was peaking. This is a drastic sign that we may be entering La Nina territory.
Of course, the whole equilibrium needs to be changed for us to actually enter a La Nina. And there is a lot more to trade wind analysis than just the surface currents.
Let’s take a look at the trends in the actual winds.

Trade winds in the Tropical Pacific were very weak this past Autumn, but have clearly begun to strongly converge again this month. However, we are still not nearly at the point of the mature La Nina event from November, 2010. (TAO/Triton).
The late October image shows very weak trade winds — no defined direction for most of the Equatorial Pacific — with even some hints of a west to east flow to the winds near the International Dateline. The anomaly portion shows a strong westerly anomaly, an indicator of maturing El Nino conditions. However, the middle image shows what we currently have — a drastic change. The trade winds are uniform and very well-defined, and converging at the Equator. The converging leads them to accelerate and allows the east to west flow to be the prevailing direction. This is a classic indicator that the El Nino is declining. The third image is from one of our most recent La Nina events in 2010-2011, which was a moderate to strong La Nina. As you can see, the trade winds are much stronger, much more defined, and much more anomalous, even than we are now. So we have a long way to go before we can say that we have maturing La Nina conditions. Regardless, we are heading in the La Nina direction, but it is too early to say whether we are going full-on La Nina.
More evidence of this uncertainty is the projections of the winds going forward. Different algorithms are painting different pictures.
The CICS-NC website produces many plots about the current and future state of the Tropical Pacific. Below is an image showing what has been occurring and what is forecast to occur with regards to the winds at the 850mb level.
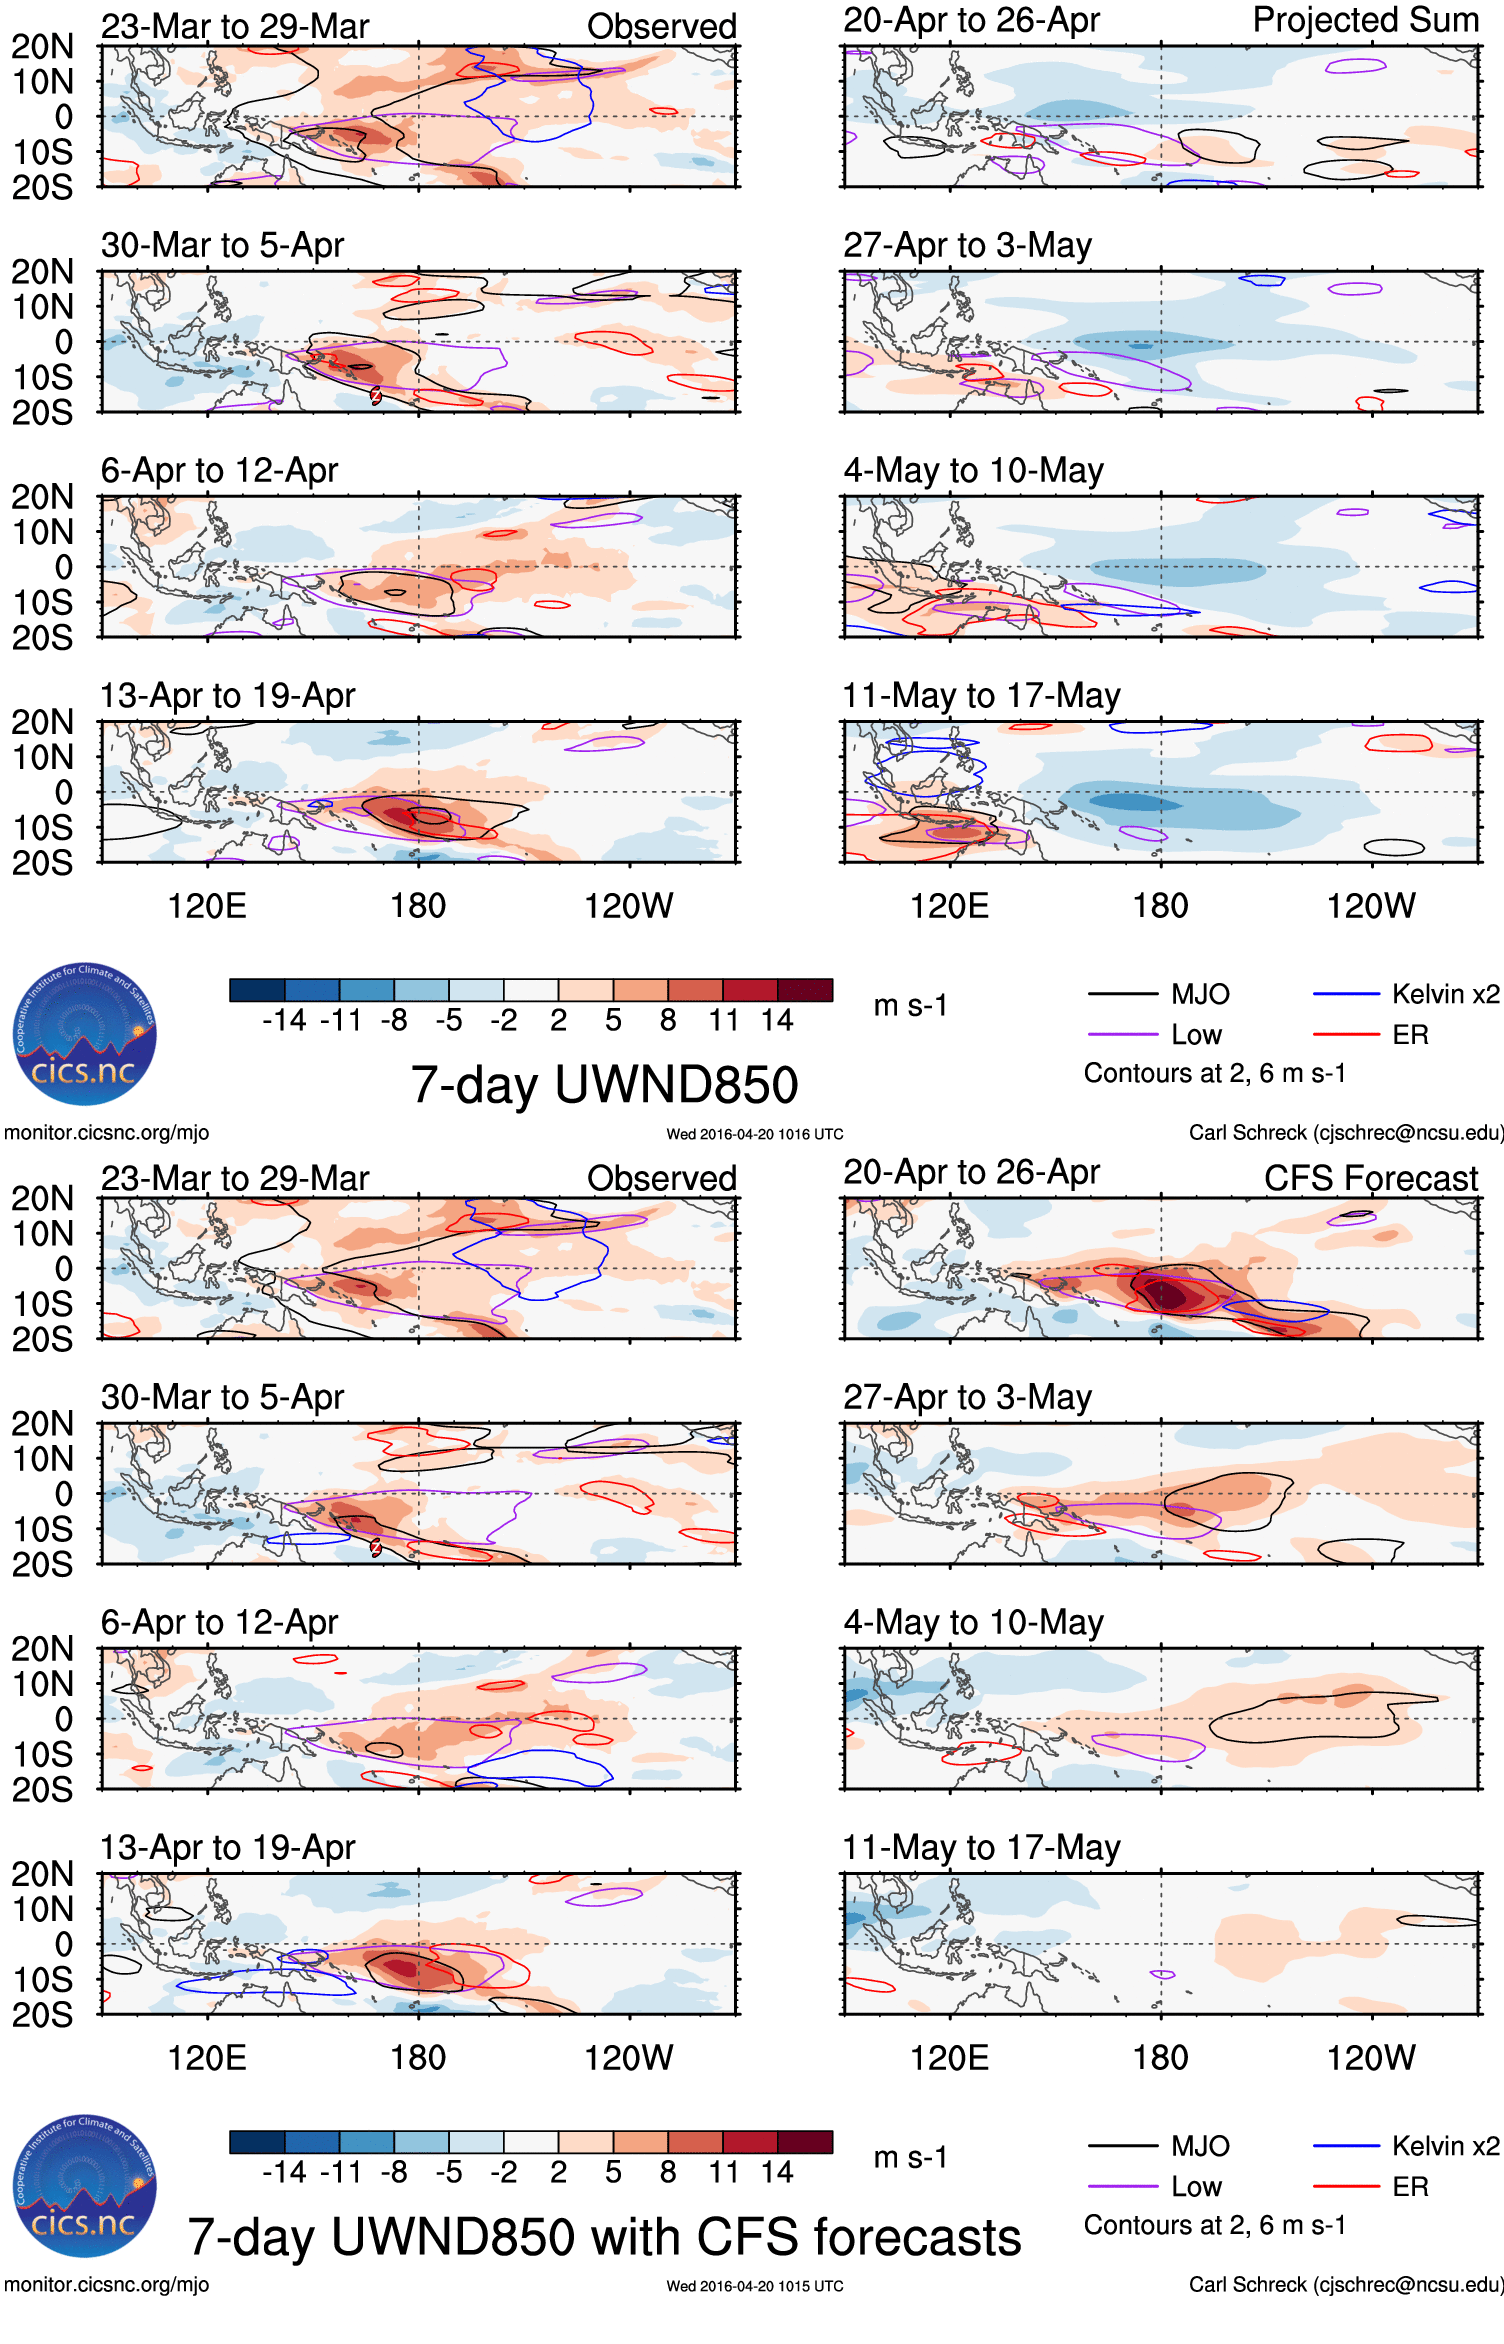
The Wheeler and Wickman method (with some slight tweaks) produces much stronger trade winds than the CFS forecast (CICS-NC).
The left columns are what has been observed, and the right columns are the forecasts. The top forecast is essentially the Wheeler and Wickman method (2001), while the bottom forecast is from the CFS model. The observed charts show that we have had positive anomalies, which are west to east flowing anomalies — which continues the theme of weak and/or reversed trade winds = El Nino (the + x direction is to the right, which is why positive anomalies are a west to east direction). The Wheeler and Wickman method forecasts the 850mb winds to rapidly reverse into negative anomalies, which would mean stronger than average trade winds, and thus a turn towards La Nina conditions pretty quickly, with perhaps a strong La Nina if that pattern were to continue. The CFS model does show less positive anomalies for sure, which would indicate a trend towards “normal” trade winds, but certainly not enough of a trend to where we would believe that a La Nina is imminent. This is especially odd, since the CFS model actually is showing a strong La Nina developing, regardless, which contradicts its 850mb wind forecasts. It would certainly give pause to the idea of a strong La Nina being imminent, as the CFS forecast could lose credibility if it doesn’t match up with its own 850mb wind analysis. That being said, the positive anomalies weakening is still evidence that a La Nina is possible, but the discrepancy makes it hard to decipher for sure how it will evolve.
2. The Equatorial Pacific is already cooling rapidly at the surface and subsurface.
An animation of the Equatorial Pacific temperature anomalies shows a strong warm pool getting replaced by a strong and expansive cold pool.
The beginning of the animation starts in mid-February, when the El Nino was still alive in full-force. Not surprisingly with the recent strengthening of the trade winds, that warm water was rapidly erased and only a very thin portion of that warm pool remains right at the surface. Just below the surface, a large and expansive cold pool has developed. Last year at this time, we had the exact opposite scenario. A downwelling Kelvin wave was pushing warm water down to the subsurface and leading to an incredible warm pool. But these Kelvin waves generate Rossby waves that move in the opposite direction, both when they form in the Central Pacific and later on when they hit Peru. Once the first batch of Rossby waves hits Asia, they reflect back as eastward as an upwelling Kelvin wave, which meets with the upwelling Rossby wave that reflected westward from Peru. Thus, we now have both an upwelling Kelvin wave that has pushed up cold water from the deep depths towards the surface, which led to a significant cold pool, and upwelling further east (from the Rossby wave), where some of the cold pool water is allowed to get pushed upward towards the surface, replacing the previously very warm El Nino water. This upwelling is further enhanced by the strengthening trade winds that we previously showed. This is a classic progression towards a La Nina. For more information on Kelvin waves, Rossby waves, and how they affect El Nino, you can check out this resource.
Previously, we showed that we are still not anywhere near the full-on La Nina conditions from November, 2010, but that is not necessarily a fair comparison, since this potential La Nina event is just blossoming. We can instead compare where we are now to Aprils of previously budding La Nina events.
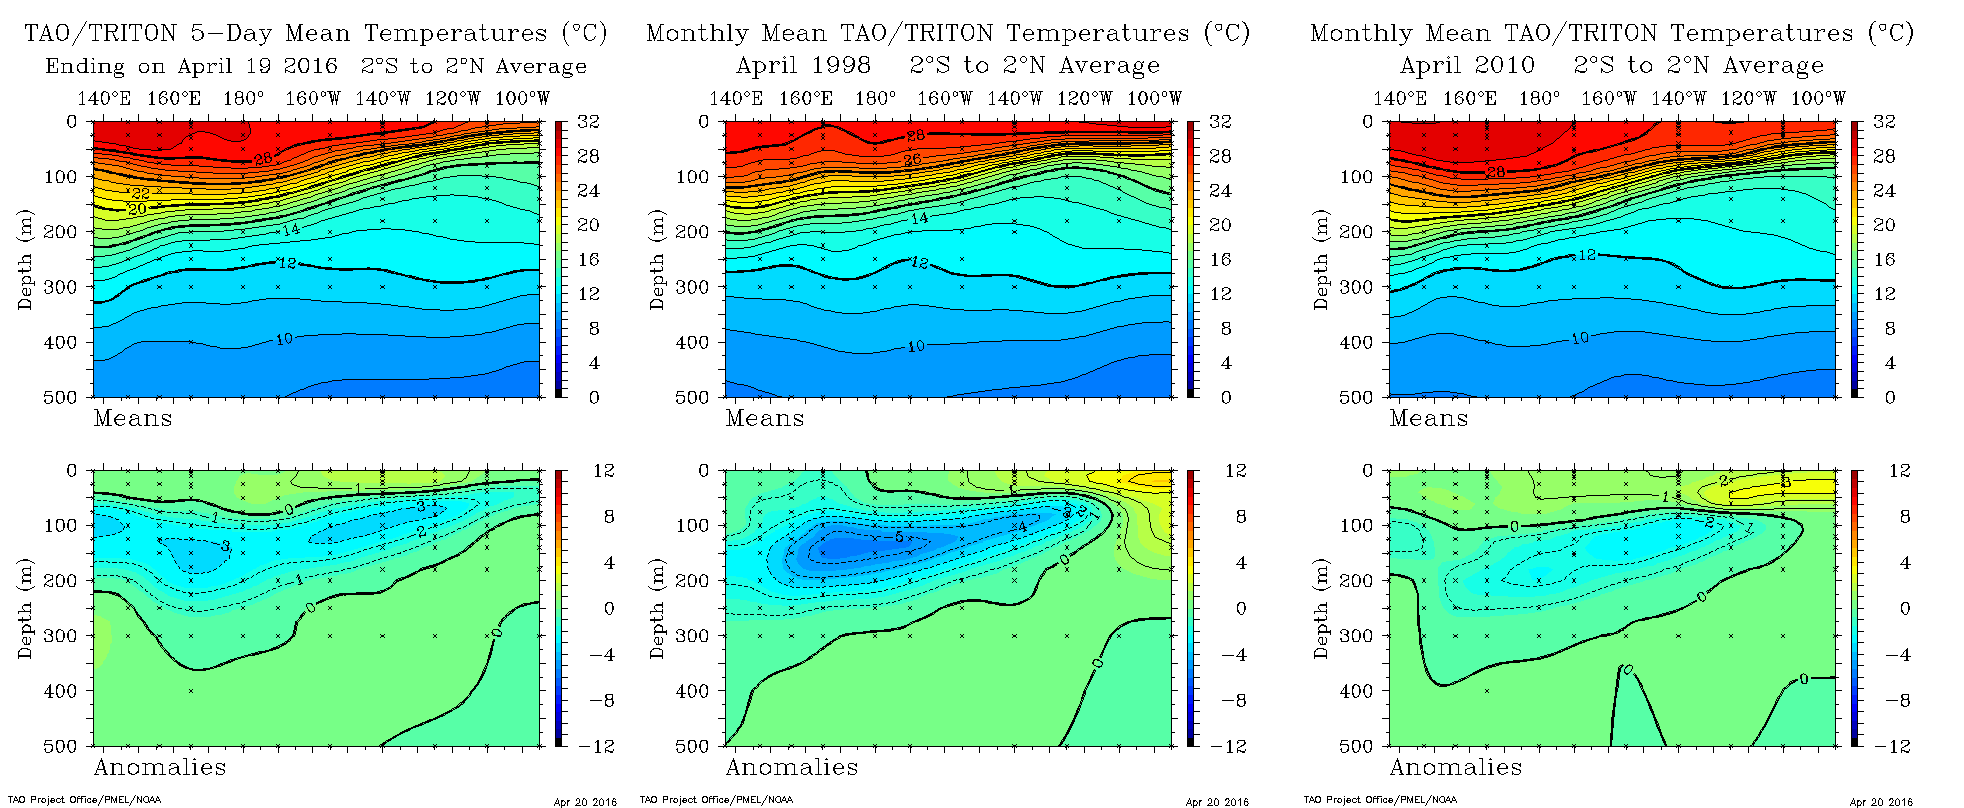
A comparison of where we are now at the surface and subsurface shows that we are well behind April, 1998, but right-on par with April, 2010 (TAO/Triton).
The image that stands out is the one in the middle: April, 1998. That year has a massive cold pool at the subsurface with extreme cold anomalies; we are nowhere near that right now. Additionally, a lot of that cold pool had already somewhat been manifested at the surface in the western El Nino regions. This could be because 1998’s El Nino was much more east-based, and thus colder in the western El Nino regions to begin with — there was a stronger gradient. This means that there was theoretically more cold water available to be downwelled with the Kelvin Wave, which could mean a more drastic transition into a La Nina than this year. And considering how strong the El Nino was to start, a drastic flip is needed in order for a strong La Nina to result. The 1998-1999 La Nina was a borderline strong one, and that event continued all the way through 2000, where we had another borderline strong La Nina.
That being said, our cold pool is actually a bit further along in its eastward progress, which could mean that the transition is occurring a bit quicker, just not as drastically. Not coincidentally, the ECMWF is showing a summer peak in the La Nina, before a rise towards neutral later in the autumn. This would be highly unusual, but it does go to show that perhaps there is something to our cold pool moving east pretty quickly. Additionally, our cold pool is actually a tad colder than that of April, 2010, and that year ended up also having a borderline strong La Nina at its peak. Granted, that year’s previous El Nino was not nearly as strong as this year’s, so it might not have as much validity in a comparative analog sense. But it does go to show that you do not necessarily need a giant -5C or greater anomalous cold pool for a borderline strong La Nina to result. Any further analysis gets us to talking points that are hard to conclusively differentiate moving forward.
3. La Ninas tend to follow Strong El Ninos.
The term “the rubber band snapping” has been used a few times in this article. It’s because of the fact that when a very strong El Nino develops, it cannot sustain itself forever. It generates Kelvin Waves that move eastward, but once they hit Peru, they come back as Rossby Waves that move back westward and help to reverse the warming that the Kelvin Waves did. Thus, it would make sense to conclude that stronger El Ninos –> stronger Kelvin Waves –> stronger Rossby Waves –> a stronger and faster reversal of the warming into cooling, and thus a stronger La Nina. It can be said that a La Nina is the atmosphere overcompensating for the El Nino, and that the El Nino sends its own delayed seeds of self-destruction with the Kelvin wave-induced Rossby waves, which is why La Ninas often follow El Ninos.
Eric Webb provided some interesting analysis about this transition, which can be found in this Wunderground article: Out of the five Super El Ninos that have been recorded (1877-1878, 1888-1889, 1972-1973, 1982-1983, and 1997-1998), all of the following Autumns resulted in a La Nina of some kind, with only 1983-1984 being a borderline neutral/weak La Nina event; yet even that La Nina eventually turned moderate in 1984-1985. If we are using Super El Ninos as our base analogs, then four out of the five featured La Ninas of moderate intensity or stronger in the following year, which certainly gives more credence to the idea of a La Nina being imminent. El Ninos that were moderate to strong usually led to La Ninas, but there were many more exceptions in those cases, so when one increases the sample size to include more El Nino events, the transition is not as guaranteed. But then again, more data does not necessarily mean better data if the additional data is not as accurate of a representation of what is going on.
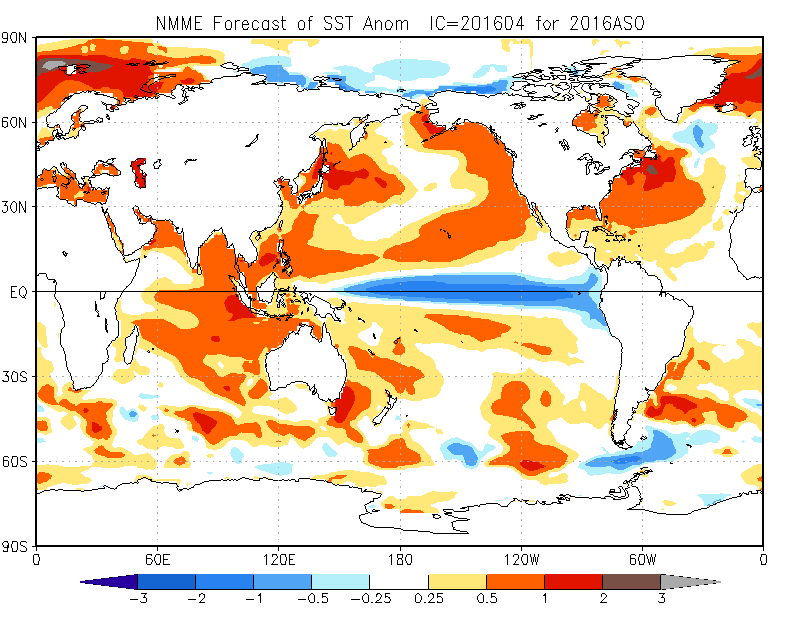
4. Most climate models are now forecasting a La Nina.
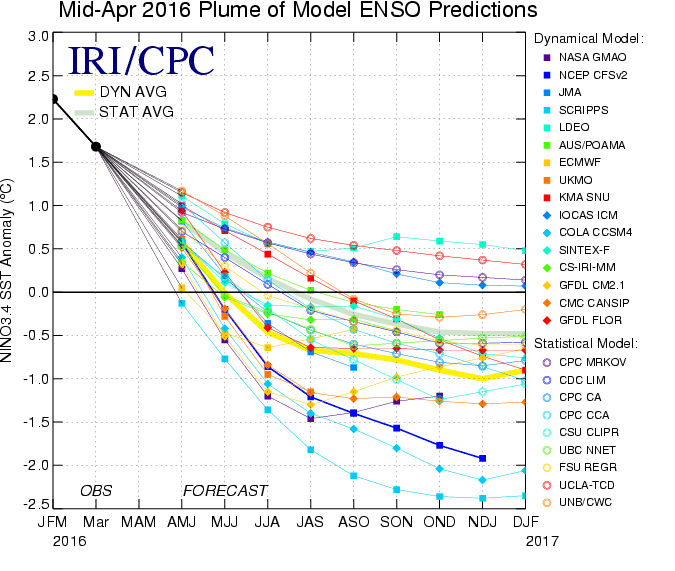
The latest IRI/CPC models have trended towards a La Nina.
In an anomalous sense, trimonthly ranges in between -0.5 and +0.5 indicate ENSO neutral conditions, while -0.5 to -1.0 indicates a weak La Nina, -1.0 to -1.5 indicates a moderate La Nina, and -1.5 or greater indicates a strong La Nina. While there is a lot of spread — anything between warm neutral and super strong La Nina — the mean of the models shows a La Nina in the high-end weak/low-end moderate range. Considering the pretty quick transition we have already seen towards a La Nina — or at the very least, away from El Nino — the models that still show positive neutral conditions seem very unrealistic. However, we have never had a La Nina with anomalies of -2.0C or greater in our recorded history, so the models showing a “super” La Nina also seem very unrealistic.
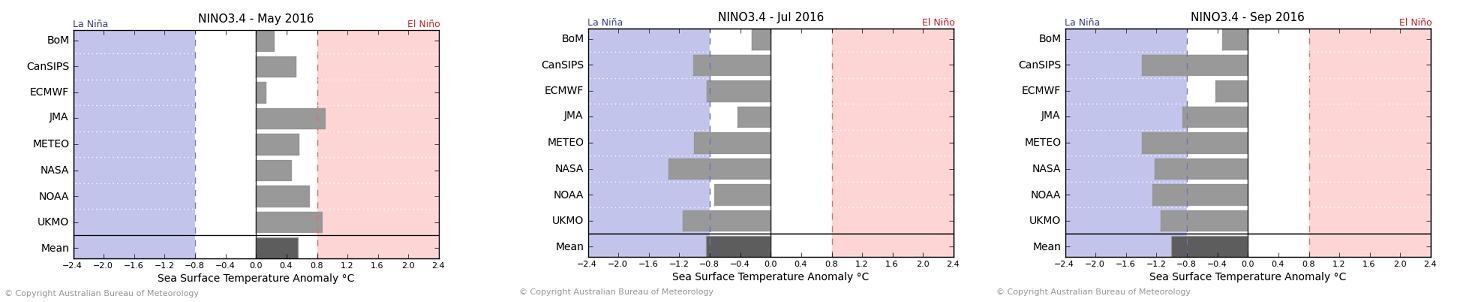
The BOM ENSO models paint a bit more of a realistic picture: all of them show weak to moderate La Nina conditions at the event’s peak.
The BOM ENSO models show a tighter cluster of weak to moderate La Nina conditions developing.
We are still in what we call the “spring forecast barrier” period in ENSO forecasting, as the spring transitional period often provides more volatility in the data, as well as the fact that the lead time is still quite large when it comes to what will happen several months from now. Once we enter the summer period, the forecasting accuracy of ENSO models tends to improve drastically, at least pertaining to the peak of the upcoming ENSO event.
That being said, there does seem to be a pretty strong consensus that the atmosphere is somewhat dramatically flipping towards La Nina conditions, and even a decent amount of support for the La Nina to potentially be moderate to strong. There is enough contrarian evidence, though, to not have high confidence in the La Nina obtaining that intensity, and the atmosphere still has plenty of work to do in order to resemble a classic La Nina. If we were to guess right now, we would say that a La Nina of some sort is likely this Fall, and that it would be at a moderate intensity. The next highest odds would be for a weak La Nina, followed by a strong La Nina, followed by neutral conditions.
Over the next few days, we will be writing an article detailing what this La Nina could mean for our weather. It will certainly be a different atmospheric circulation than what we have seen in the past several months.
Trackbacks & Pingbacks
2catalyst
Comments are closed.