-2")
How the North Pacific Ocean offers winter clues in November
With Autumn very obviously and officially underway (have you been outside this morning?), questions have begun to surface regarding the upcoming winter — and if the Autumn pattern will foreshadow it. Unfortunately, it isn’t quite as simple as “A cold October means a cold winter” or ” A warm November means a warm winter”. If that were the case, we’d have long range forecasting figured out by now, and there would be much less urgency to winter outlooks. Instead, meteorologists use “drivers”, analogs, teleconnections, and ensemble guidance to help with seasonal forecasts. When used together and properly weighted, these tools provide a higher probability of success in medium to long range forecasting. These methods are far from perfect, but can help offer us clues as to how the coming season will play out.
One major piece of the Winter’s puzzle can be found in the form of “clues” in the North Pacific Ocean. Meteorologists use different oscillations to measure the pattern in the North Pacific over time. The pattern in the Eastern Pacific Ocean is represented by the aptly named “East Pacific Oscillation” (EPO). Like the North Atlantic Oscillation (NAO) the EPO has certain generally predictable outcomes when it oscillates from positive to negative phases.
The positive phase of the EPO is usually associated with lower than normal atmospheric heights in the Northeast Pacific, Alaska, and Northwestern Canada. The positive (+EPO) phase tends to flood the United States with maritime pacific air, due to the lower pressure around Alaska. The low pressure near Alaska, often into the Gulf of Alaska, allows the Pacific jet to push into the Western United States and often cuts off the flow of cold air into the United States as well.
Conversely, the negative phase of the EPO (-EPO) generally produces higher than normal heights over the same regions of Alaska and the Gulf of Alaska. This often sets up a cross-polar flow in the winter months with the atmospheric flow oriented across the North Pole from Siberia into Canada and the United States. Strongly -EPO patterns have yielded some of the most impressive, severe arctic outbreaks on record.
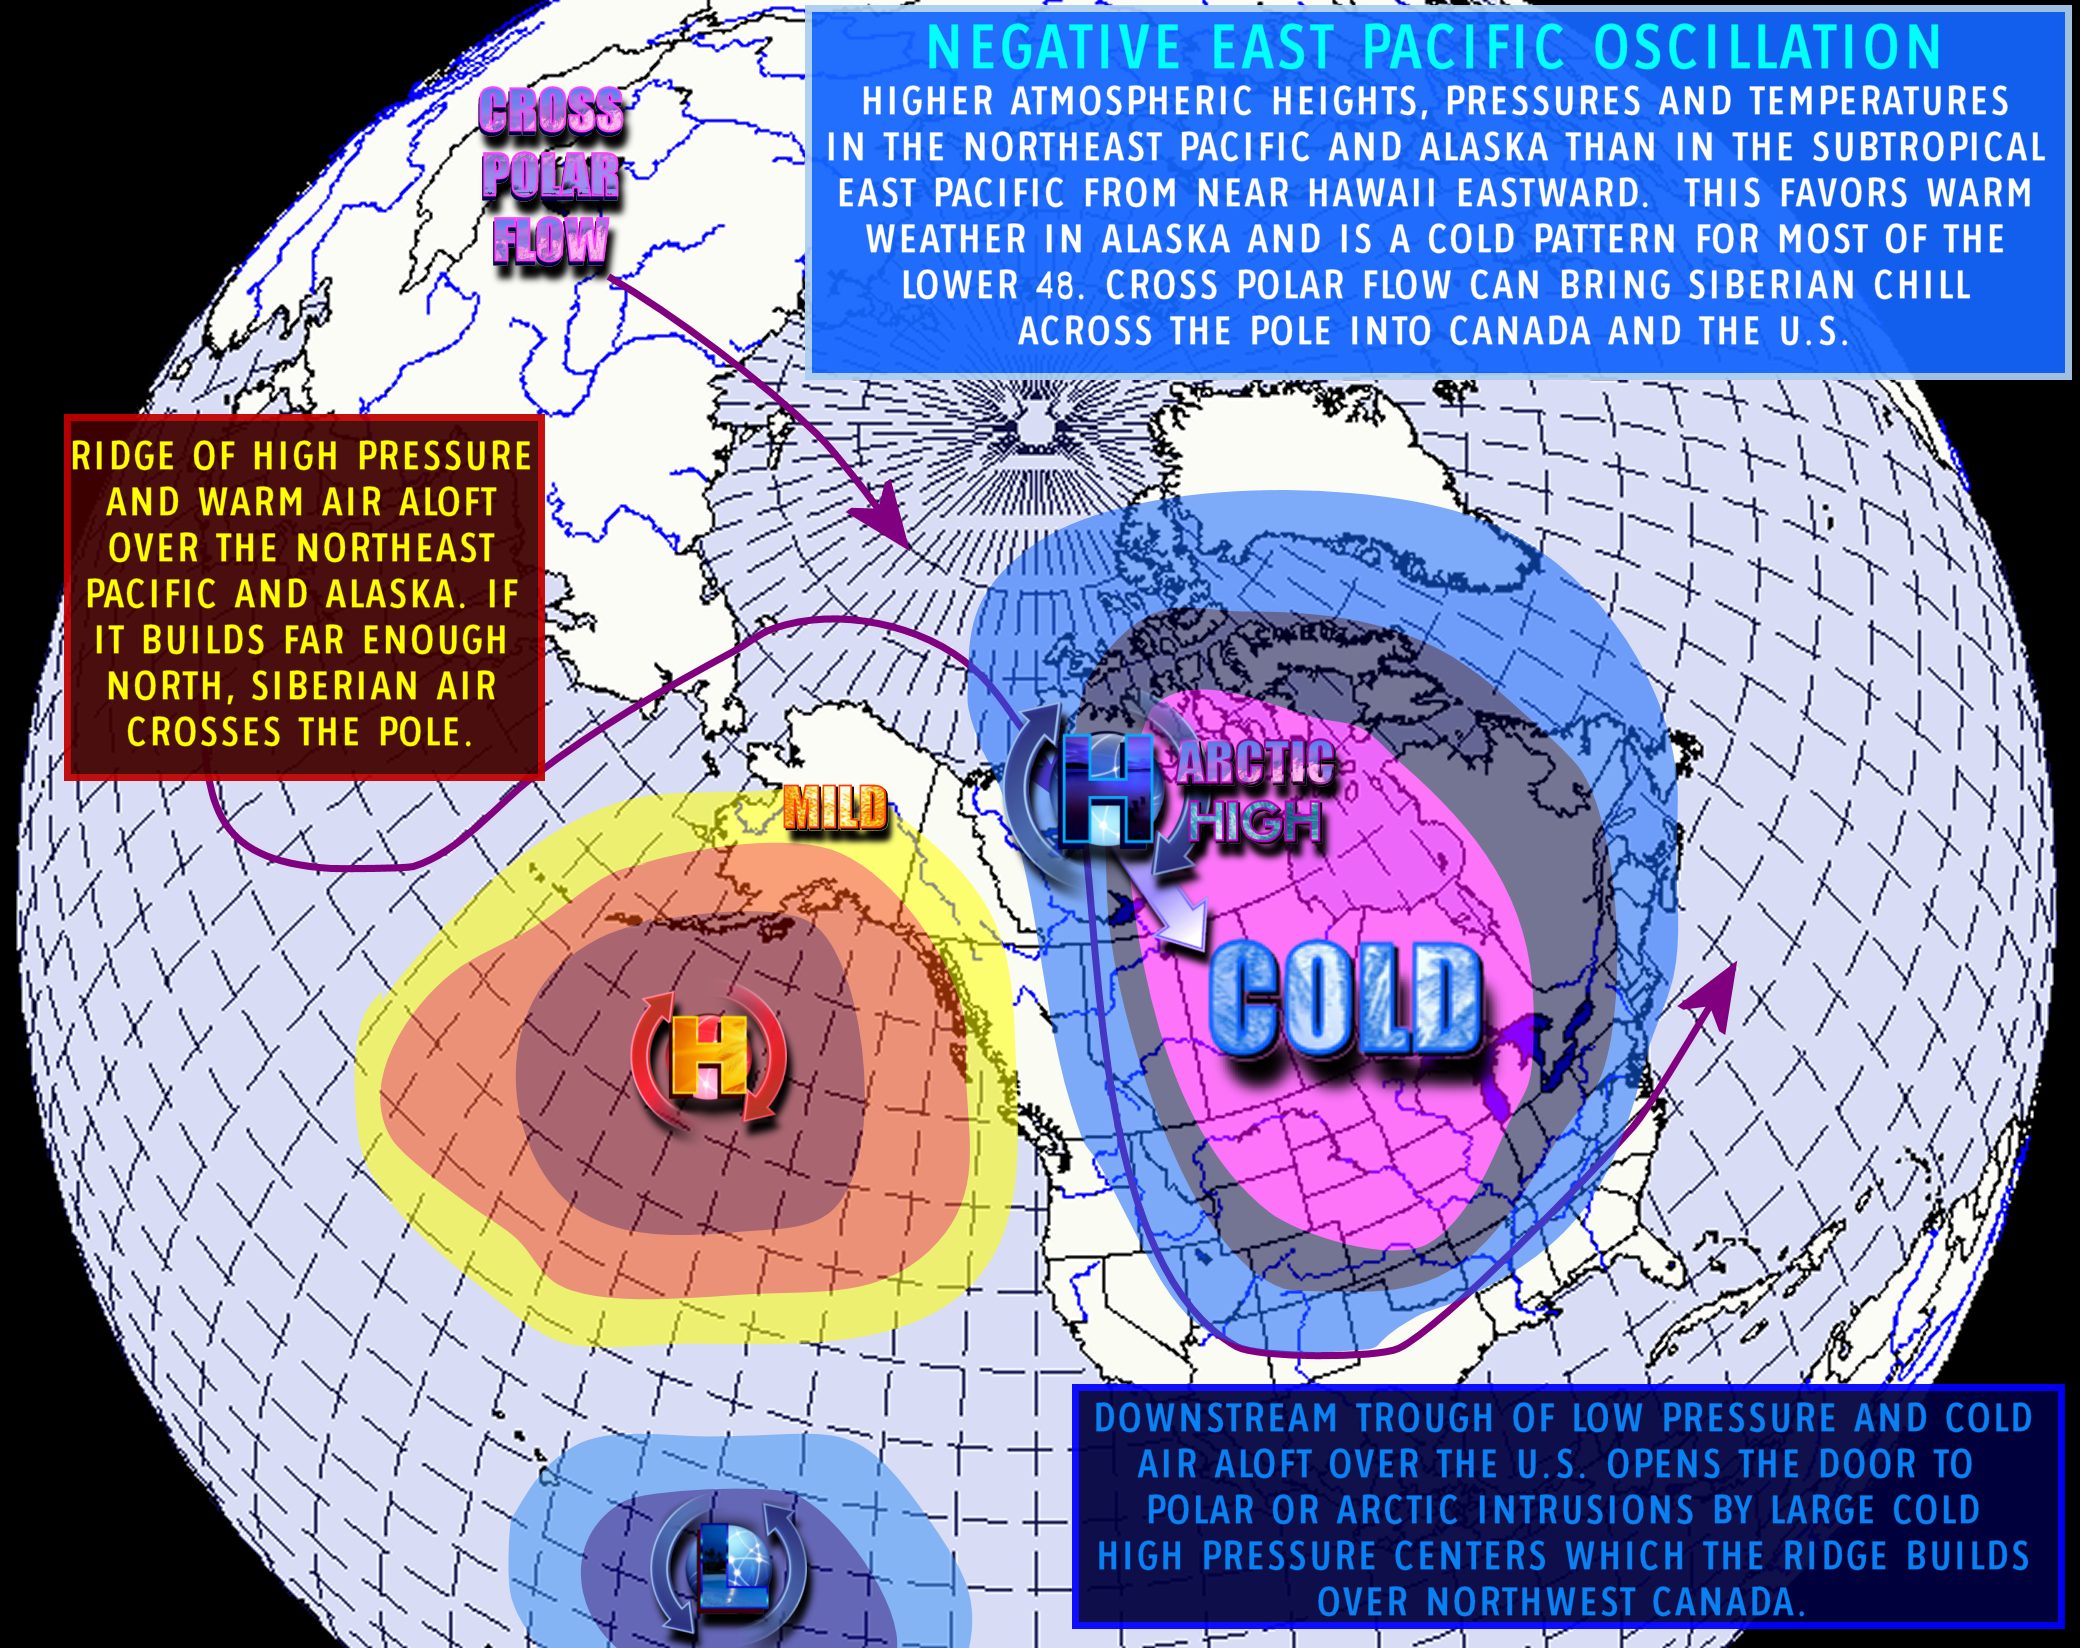
A graphic representation of a classic Negative EPO (-EPO) phase, with a cross polar flow bringing cold air into Canada and the United States. (The Daily Pennsylvanian)
Data since 1990 (a relatively small sample size) presents us with some interesting clues when analyzing the state of the North Pacific and EPO in November, rolled forward to the following winter. In other words, our team has taken colder than normal/snowier than normal winters in the NYC Metro Area (used as an example) and rolled back the state of the atmospheric pattern to the November preceding it. Breaking down this data to be more simply understood produces some compelling graphics.
The Novembers preceding the colder/snowier than normal winters in NYC since 1990 produce the following 500mb atmospheric height anomaly composite. These maps show the departure from normal heights (wave pattern) in the atmosphere.
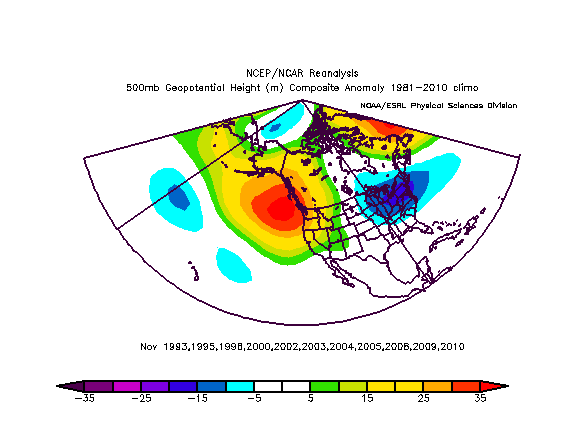
November 500mb pattern preceding the snowier/colder winters since 1990.
The most notable features are ridging throughout the Northeast Pacific along the West Coast of the United States. This ridging, as discussed above, is associated with a -EPO pattern and is very important in allowing colder than normal air to begin to filter down into Canada and eventually the United States as the winter draws closer.
Notable, also, are below normal anomalies in the Great Lakes and Eastern United States. The -EPO pattern established during the month of November aids in the development of colder air via a cross-polar flow as the month goes on.
On the contrary, winters that featured less snow and warmer than normal temperatures, when rolled back to November, featured a nearly opposite pattern in the Pacific Ocean. Instead of a large ridge along the West Coast and Gulf of Alaska, there is a large trough — associated with a +EPO index. This has major implications on the downstream pattern. Notice how higher than normal heights generally are present across the Continental United States as a result of Pacific, maritime air flooding into the Country.
‘
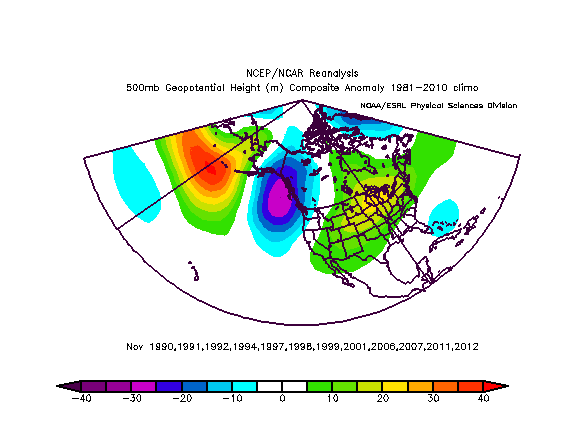
November pattern preceding the warmer/less snowy winters since 1990.
While these conclusions seem fairly startling, there are a few things to consider. First, remember that the sample size is quite small relative to time. These analog composites only consider roughly 23-24 years of data. So additional variability has to be considered within a longer time span. Second, the impacts of the global pattern can’t be understated. Each of these years, despite the sample size, had separate surrounding conditions. Consider the pattern in the North Atlantic, the ENSO state (this year features a borderline weak La Nina), etc.
The North Pacific Pattern is just a piece of a very large puzzle which we will try to piece together over the next few weeks as Winter approaches. That being said, time has proven that it is a very important piece to the puzzle — one which may very well give us some important clues into the Winter ahead. Current forecast models indicate a rising (+EPO) index, at least to start the month of November.
**For more detailed analysis, explanations and breakdowns of the weather pattern, sign up as a Premium Client at New York Metro Weather. Premium posts like these are pushed to clients at least once per day. Our team of forecasters offer a direct, personalized, and detailed forecast which is tailored to each client we work with. We are proud to offer special options for the winter ahead, available upon inquiry.