-2")

Winter Forecast 2016-2017
Seasonal forecasting is one of the most misunderstood aspects of meteorology. Not only is it a difficult task for the meteorologists themselves, but it is often difficult for readers and public viewers to understand the nature of the forecast. The root of the problem lies in the fact that seasonal forecasting is based on many different methods — all of which have tremendous variability and low percentage verification. Seasonal forecasting begins with an analysis of current conditions and atmospheric circulations, similar to any daily forecast. Beyond this point, forecasters use variables such as sea surface temperature anomalies, analogs, and comparative methodology to compile a forecast.
Some forecasters have detailed the mentality very well when they have stated that long term forecasting is very much about “What can go wrong” as opposed to “How will the forecast be correct”. Our job as meteorologists is to detail the aspects that have formed the foundation for our forecast, express our concerns and confidence in all aspects, and deliver the ideas which we have formulated as a result of our research and work in attempting to understand the patterns evolution over the next several months.
We will begin by highlighting several variables which we have researched. Each variable will be listed with a conclusion and prediction on its state during the winter, as well as the methodology and reasoning behind that forecast.
El Nino Southern Oscillation (ENSO)
Prediction: Weak Central Pacific La Nina
The state of tropospheric weather conditions throughout the tropical pacific (El Nino, La Nina or La Nada) is a significant factor in any Winter Forecast, regardless of the strength or intensity of the associated ENSO event. The conditions in the tropical pacific can have effects on circulations throughout the entire globe.
After a very strong El Nino last year, the atmosphere appeared to be rapidly transitioning towards a La Nina. However, trade winds never picked up to strong levels on a consistent basis, and the SOI has struggled to remain near La Nina values. The SOI is an index which observes sea level pressure differences between Tahiti and Darwin, Australia. The modality in the SOI is suggestive of how the atmosphere is behaving — with positive values near or over +6.0 suggesting La Nina conditions while negative values near or over -6.0 suggesting El Nino conditions. October’s SOI value averaged at -4.5, which is closer to El Nino values than La nina values.

Daily Sea Surface Temperature Anomalies at the time of our Winter Forecast. Particularly notice the weak “below normal” areas in the Pacific Ocean near the equator.
The lack of trade winds, amongst other things, has prevented a true widespread push of cooler eastern Pacific Waters and subsequent upwelling from taking place over the Equatorial Pacific. This has kept the La Nina from developing with any significance, and instead there are currently neutral ENSO conditions (a borderline weak La Nina) in place.
With all of that said, the state of the Tropical Pacific can offer us some clues. ENSO region 3.4 continues to move into Weak La nina territory with values near -0.9 over the past few weeks. Regions further east are warmer, particularly ENSO regions 1+2, which have been fluctuating but remain generally near 0. Overall, the suggestion is that we currently have a weak/ borderline Central-Pacific based La Nina in place. While the atmosphere as a whole has not displaced true La Nina conditions, the placement of convection in the tropical Pacific does have “La Nina suggestive” patterns.
During La Nina’s, the warmest Equatorial Pacific waters are “forced” further west towards Indonesia due to trade winds, which leads to more convection in those regions. This convection leads to less outgoing longwave radiation (OLR) because the convective cloud tops block the OLR from escaping back into space. Just downstream, dry air and subsidence occur to balance that out with more significant OLR. This pattern has been observed over the last 30 days, aiding in the aforementioned “convective evidence” of a Weak La Nina.
While a weak ENSO state usually suggests it will not be a “driver” in the forecast, it will be quite relevant to the winter forecast this year. La Nina’s tend to aid in the development of more ridging near the Aleutians, which can lead to colder air being displaced from the Arctic and into Canada, and occasionally the US. This is why La Nina winters are typically colder in Canada and the US when compared to El Nino winters. The amplification of the pattern during La Nina winters becomes quite important, as a ridge in the Southeast US can also become a noteworthy feature over time.
Strong El Nino events send a large amount of latent heat into the atmosphere. This means that there will typically be some sort of “El Nino Lag” that takes place as the globe transitions from an El Nino to La Nina circulation. What has occurred thus far in October and November throughout the Pacific suggests that this very well may be occurring. La nina events that occur after El Ninos, like this one, tend to have more poleward Aleutian ridging, a stronger Pacific Jet, and a stronger Subtropical Jet, with a more negative Arctic Oscillation. This also tends to reduce the Southeast ridging somewhat and helps the Eastern United States observe more troughing.

Analog year composite suggests troughing and some high latitude blocking early in the winter months.
There has been additional research conducted in regards to the NAO state during La Ninas. A La Nina focused in the Central Pacific, like this one, tends to favor a more positive NAO over time, while a La Nina centered in the Eastern Pacific tends to favor a more negative NAO over time.
Overall, the state of Tropical Pacific going into this winter is suggestive of a Weak La Nina, Central Pacific Based, with a moderate degree of El Nino lag from last years event. This was factored in significantly toward our Winter Forecast.
Pacific Decadal Oscillation (PDO)
Prediction: Neutral to positive PDO
The PDO can generally be monitored by observing the sea surface temperature anomalies and associated circulations of air in the Northern Pacific Ocean. The PDO has averaged positive over the past several winters with a very noticeable “blob” of warmer than normal water in the North Pacific. However, the PDO observes cycles over larger periods of time — as do all other indices — and the prolonged positive phase of the PDO appears to be coming to an end or, at least, weakening.
Cooler waters have been observed near the West Coast of the United States, indicative of a weakening +PDO influence. However the modality and overall SSTA distribution remains positive. A positive PDO supports more troughing near the Aleutian Islands, with ridging near the Western USA coast.
This often aids in colder air being displaced southward from Canada towards the United States. This pattern is expected to continue overall throughout the winter, while becoming less amplified over time with the PDO gradually weakening towards neutral by the end of the DJF trimonthly period.
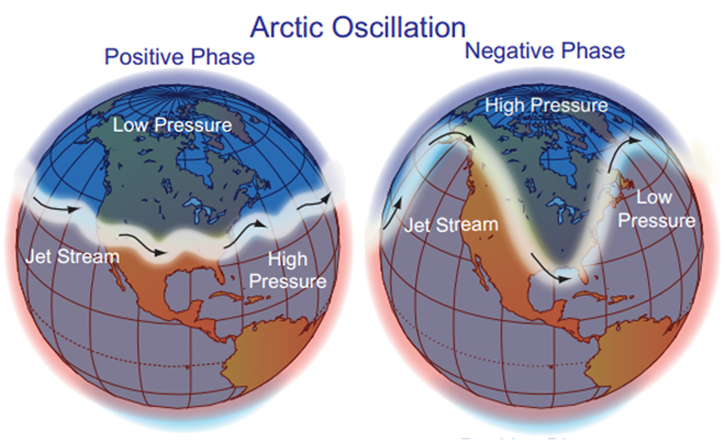
Arctic Oscillation (AO)
Prediction: Predominantly neutral to negative
Much has been made over the past several winters in regards to the Arctic Oscillation, and rightfully so — its modality has a significant correlation to cold air over the United States. A more negative Arctic Oscillation is associated with colder air surging southward from the pole toward Canada and, often, the Northern 1/3 of the United States.
Confidence is high that the Arctic Oscillation will average neutral to negative during the winter period, with periods of moderate to strong negative modality. This is primarily based on the stratospheric polar vortex which has been significantly disrupted during the Autumn months. Near to above normal Eurasian snow cover — still increasing steadily with time — is leading to a stronger Siberian High Pressure and more impressive heat flux into the atmosphere. This will continue to lead to wave-breaking and stratospheric warming events which will displace the Polar Vortex away from the North Pole with perhaps partial or temporary splitting of the stratospheric vortex through at least the end of December.
The CPC Arctic Oscillation value registered -1.917 for the month of October. There is a continued correlation between a -AO value in October and a -AO modality in the winter that follows. While the AO state is likely to be affected by the stratospheric response to the QBO as well, a negative modality was favored over time due to the aforementioned events.
Eastern Pacific Oscillation (EPO)
Prediction: Predominantly neutral to negative
While not a tandem by definition, the EPO and AO are similar in that their negative modality suggests the propensity for arctic air to be dislodged southward. Periods of moderate to strong -EPO typically result in ridging over Alaska and/or British Columbia displacing arctic air to the south.
The continuation of polar vortex displacement events is likely to support the development of higher pressures near Alaska this year. A propensity for high latitude blocking to develop throughout the Pacific ocean additionally suggests that ridging may build into British Columbia and parts of the Western Arctic. In addition, a +PDO and warm north Pacific Sea Surface Temperature anomalies are expected to persist. These types of conditions have historically supported the EPO averaging in a negative modality, especially during the winter months.
The suggestive Pacific pattern also will aid in the development of an overall +PNA, which while not discussed at length in this forecast, suggests ridging along the US West Coast. When combined with a -EPO, a +PNA can aid in the displacement of cold air through Canada and into the United States.
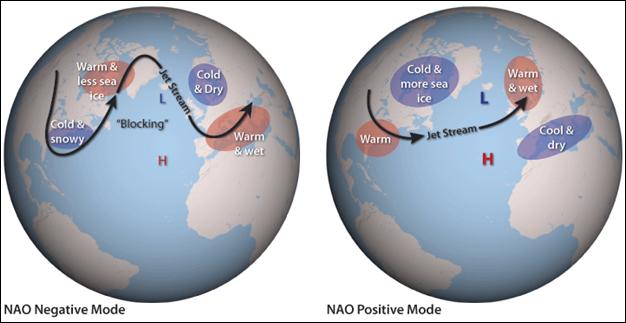
North Atlantic Oscillation (NAO)
Prediction: Predominantly neutral to positive
The North Atlantic Oscillation, or NAO, is one of the more well known indexes for predicting colder and snowier patterns in the Northeast United States. Most notably, its negative phase generally entails higher than normal heights from the Northwest Atlantic, into Greenland, and extending into North-Central Canada and the poles. The positive phase of the NAO, on the contrary, features lower than normal heights over the Northwest Atlantic into Greenland and North Central Canada. Historically, a positive NAO features warmer and less snowy conditions across the Northeast US, while a negative NAO features colder and snowier conditions (on a very basic meteorological level).
Significant disruptions of the polar vortex, both in the stratosphere and troposphere, have been observed this Autumn. While noteworthy, they have generally come up short of a complete and total breakdown due to higher geomagnetic activity and unfavorable zonal winds and EPO flux in the stratosphere. Higher geomagnetic or solar activity acts to tighten the stratospheric vortex over time. For instance, a near stratospheric split occurred in October of 2016, but was impacted negatively by a rise in geomagnetic activity slightly before its predicted occurrence.
There is more uncertainty than usual in regards to the nature of the NAO and associated high latitude blocking due to the unusual nature of the QBO at the present time. With that being said, the latest 30mb and 50mb values for October indicate that the QBO continues to strengthen in a Westerly Phase.
This has a modest correlation toward a +NAO for the winter ahead on average. The presence of this QBO in addition to continued geomagnetic activity and the state of the tropical Pacific suggest very little support for any prolonged periods of -NAO modality. Instead, they suggest the presence of a neutral to slightly positive NAO during the DJF trimonthly period.
Stratospheric Vortex and Warming
Prediction: Weaker than normal stratospheric vortex
The past several years have featured a stronger than normal stratospheric polar vortex from late Autumn going into winter. The stronger than normal stratospheric vortex has aided in a more positive AO and NAO on average with less high latitude blocking, especially early in the winter months. The timing and magnitude of stratosphere warming and polar vortex weakening events, along with their impacts on the tropospheric pattern, have been met with much forecast difficulty during the past. But a number of a events occurring this Autumn appear to strongly indicate that a weaker than normal stratospheric polar vortex is likely for much of the winter.
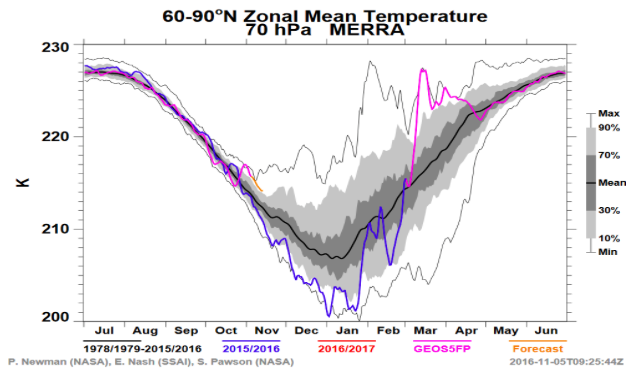
Temperatures in multiple levels of the stratosphere are running well above normal — signaling that the vortex is weaker than normal.
Hurricane Nicole initiated a tropospheric wave-breaking event over the North Atlantic. This lead to the development of a highly anomalous ridge over the Barents-Kara Sea. This contributed largely to a bottom-up (troposphere to stratosphere) warming event — and the polar vortex was significantly disrupted. Temperatures throughout multiple levels of the stratosphere warmed to well above average levels by the end of October. These are now forecast to trend toward average as effects from the aforementioned disruption event begin to wane.
Meanwhile, poleward heat flux at 100 mb on 10-day means has been above average — approaching or exceeding record levels (dating back to 1986). The 45-Day mean forecast indicates that it will remain above the 1980-2016 average into November. This trend would support warmer temperatures in the lower stratosphere and a weaker stratospheric polar vortex moving into Winter.

Heat flux remains above normal and is expected to continue to remain so — suggesting additional disruptions of the vortex will continue.
Snow cover over Eurasia cools the surface and helps induce poleward heat flux into the lower stratosphere with the formation of Siberian High. The chart below suggests Eurasia’s snow cover extent during much of October was running near average compared to the past 10 years before suddenly jumping above average at the end of October.
The suggestion from these multiple pieces of data is that poleward heat flux in the stratosphere will continue to remain above average, with a stronger than normal Siberian High Pressure in place as we move toward the winter months.
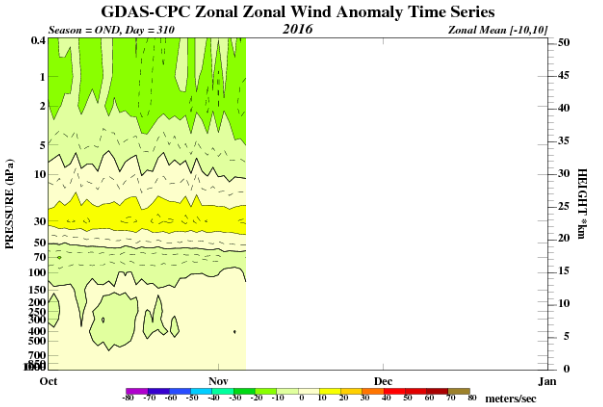
Another important factor in the state of the stratospheric vortex is the presence, intensity, and modality of zonal winds at multiple levels. Zonal winds are typically running westerly in the stratosphere. A sudden stratospheric warming event occurs when temperatures warm and zonal winds reverse to easterly at 10mb. At this time, zonal winds remain westerly in the upper-stratosphere, but have been running weaker than average at 10mb and other levels since late October.
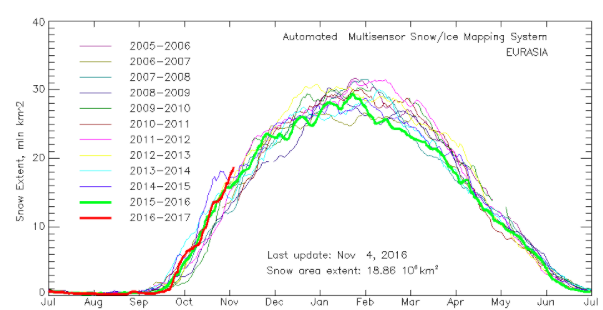
Eurasian snow cover remains above normal for this time of year.
Another important factor in the state of the stratospheric vortex is the presence, intensity, and modality of zonal winds at multiple levels. Zonal winds are typically running westerly in the stratosphere. A sudden stratospheric warming event occurs when temperatures warm and zonal winds reverse to easterly at 10mb. At this time, zonal winds remain westerly in the upper-stratosphere, but have been running weaker than average at 10mb and other levels since late October.
Forecast models are already beginning to suggest that the combination of continued poleward heat flux and weakening and/or reversing zonal winds by late November will result in a displaced stratospheric Polar Vortex.
Overall, confidence is high that the stratospheric Polar Vortex will remain weaker than normal and disrupted at least early in the winter. This could lead to the development of some high latitude blocking events. What happens from the mid-winter onward is a very low confidence forecast.
Quasi-Biennial Oscillation (QBO)
Prediction: Positive or Westerly Phase
After moving into the easterly phase in the Spring, the QBO made an unprecedented oscillation back to a westerly phase in the summer. The QBO at 30mb was near +10.00 in August and September, but has risen to +12.83 for October. Values over +10.00 tend to have more influence on keeping the stratospheric polar vortex stronger during the winter and correlates to a more positive NAO. The weaker Polar Vortex during this Autumn results in very low confidence on the state and effects of the QBO.
Overall, the state of the QBO will act to mitigate the effects of stratospheric disruptions and could, over time, result in less high latitude blocking than what may have developed if the QBO was in an easterly state.
Solar Cycle and Geomagnetic Activity
Prediction: Lower Solar Flux with Higher Geomagnetic Activity
Periods of higher solar and geomagnetic activity has been linked to a stronger stratospheric polar vortex and a positive NAO modality. Currently, we are moving toward the end of solar cycle 24. This solar cycle has lower amount of sunspots then past solar cycles recorded over the past 30 years. This could lead to a additional uncertainty and low confidence in forecasting the NAO phase during the winter.
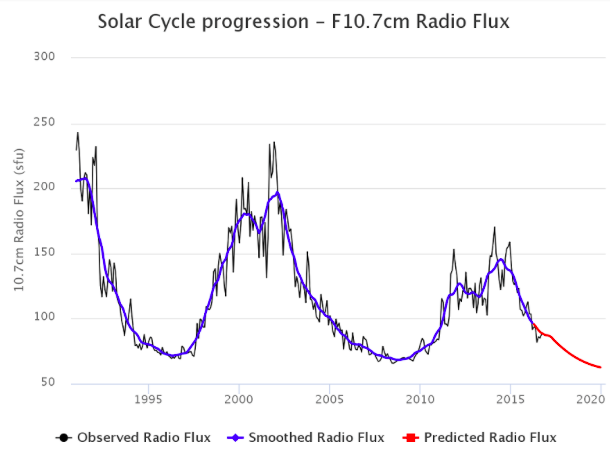
Lower solar radio flux values are occurring and solar minimum is forecast near 2019-20. Solar values are currently predicted to be in the upper 80s for monthly averages this December, January and February. This is higher than the 70-80 monthly values observed in the 2009-10 winter — which was the last “solar minimum” winter and featured a strong -AO and strong -NAO. The values this year are also projected to be only slightly higher than December of 2010, which also featured high latitude blocking and a -NAO/AO.
With solar activity expected to decrease as the winter goes on, the impacts it will have on the stratospheric vortex and resulting tropospheric weather pattern should become increasingly minimal and/or trivial.
However, geomagnetic storms with CMEs (coronal mass ejections) largely from coronal holes and solar winds, are still occurring. Higher geomagnetic activity is common during the few years after the solar max.
While the stratospheric vortex appears likely to be weaker than normal overall this winter, higher geomagnetic cycle may support some temporary strengthening. This should result in any high latitude blocking remaining transient overall, with periods of positive NAO modality and/or high latitude troughing.
Monthly Highlights and Overview
The Winter of 2016-2017 is expected to be quite changeable and noteworthy for its early start across the Central and Eastern parts of the country. More snowfall than normal is likely throughout areas like the Interior Northeast, Great Lakes, and parts of the Ohio Valley. An active storm track is likely to result in above normal precipitation in those regions as well. A warmer trend is expected by February for the aforementioned areas, while winter becomes more active across the West Coast and Rockies. An early Spring is not necessarily guaranteed as a more active pattern may return in March, especially across the Northern ⅓ of the United States.
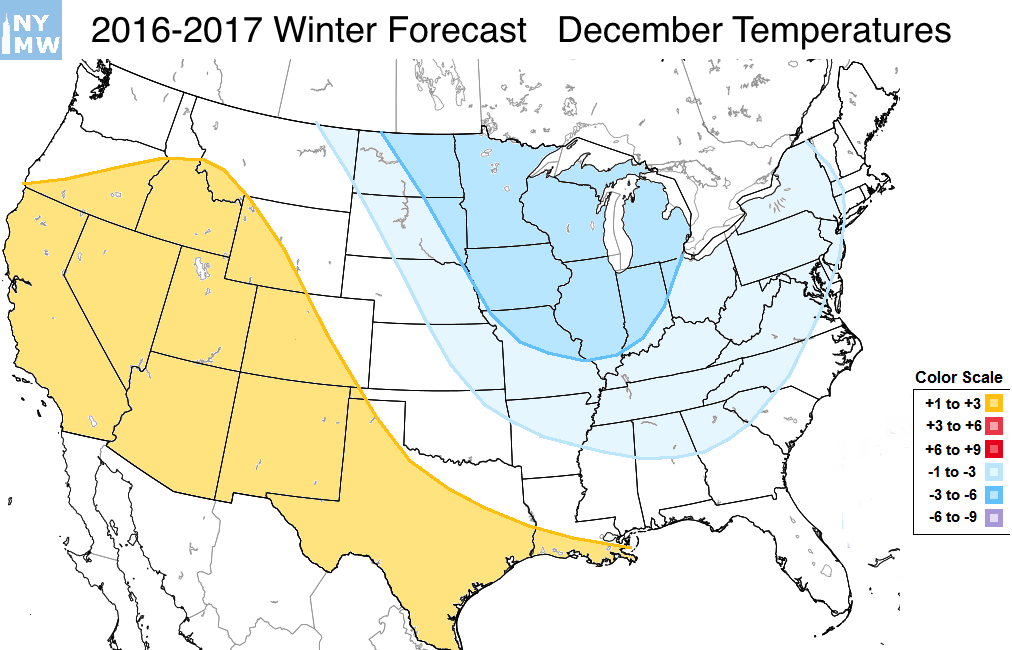
December Highlights
More ridging along the West Coast of the United States is expected to work in tandem with high latitude blocking to result in a propensity for colder than normal air to surge southward into Canada. This will be additionally aided by the development of a -EPO and -NAO at times which, while transient, could result in extreme cold air pushing towards Southeast Canada.
This air will occasionally surge southward into the Northern Plains, Great Lakes, Ohio Valley and Northeast US, with colder than normal air also extending into the Tennessee Valley, Mid Atlantic, and parts of the Southeast United States. December is expected to be the coldest month relative to normal in those areas, with a few significant winter storms possible. Warmer than normal air will remain across the Southwestern US for the majority of the month.
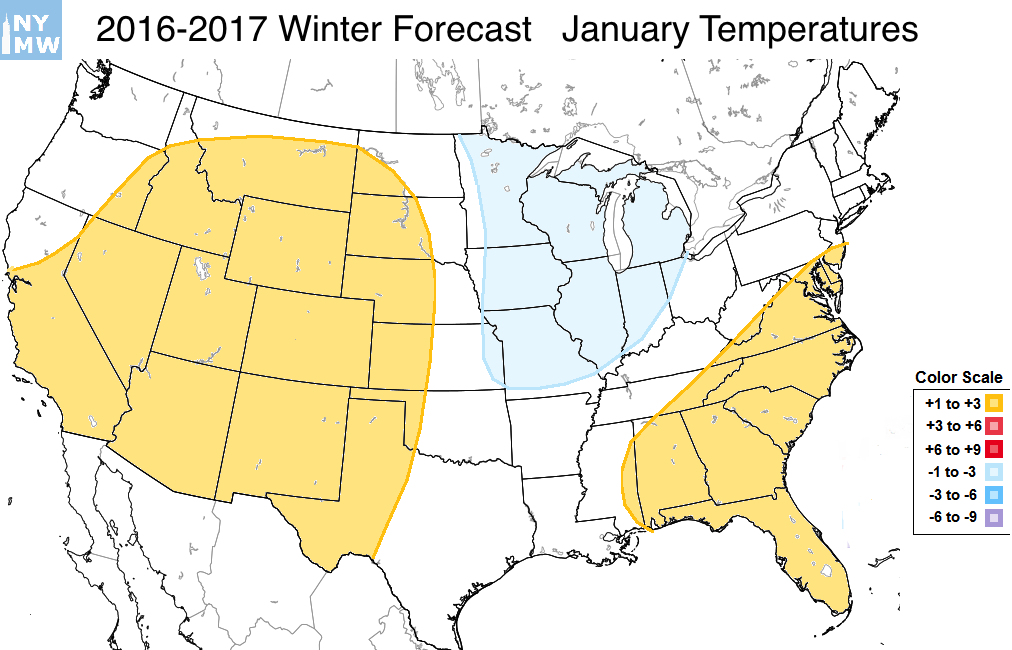
January Highlights
A transitional month is expected across the United States with the possibility of a fairly significant mid-month pattern change. High latitude blocking is expected to gradually become less likely, which will keep cold air shots farther north and west overall. With the weakening -NAO and -EPO modalities, a Southeast US Ridge is expected to become a more predominant feature as the month goes on.
With that said, ridging will continue to develop across the Southwestern United States, with below normal temperature anomalies still expected across the Northern ⅓ of the Central United States as an average throughout the month.
As the month draws on, temperature moderation is expected especially across the Central and Eastern United States where a Southeast Ridge will become gradually further established.
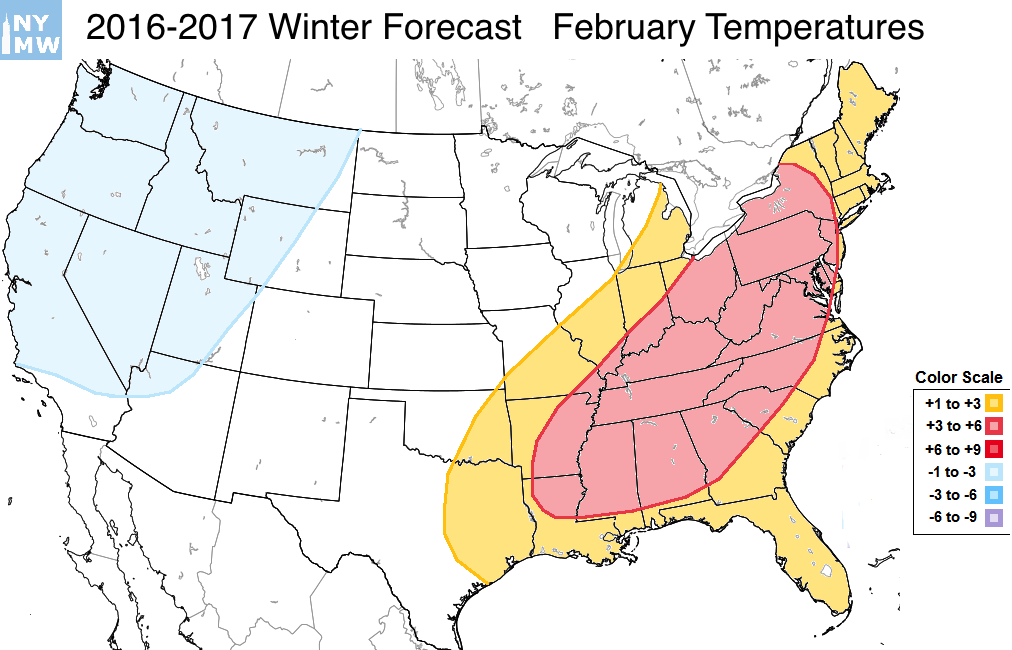
February Highlights
A retrograding hemispheric pattern is expected to lead to major changes across the entire United States during this month. The return of a vortex into the Gulf of Alaska will gradually lead to the breakdown of ridging along the Western US Coasts. This will result in more Pacific, maritime air pushing eastward into the United States.
Meanwhile, the breakdown of high latitude blocking will allow the Southeastern US Ridge to strengthen. The mean storm track will be pushed very far westward, towards the Plains States, during this month. Warmer than normal air — possibly quite significantly so — is expected throughout the Eastern US extending westward towards the Ohio and Mississippi Valley.
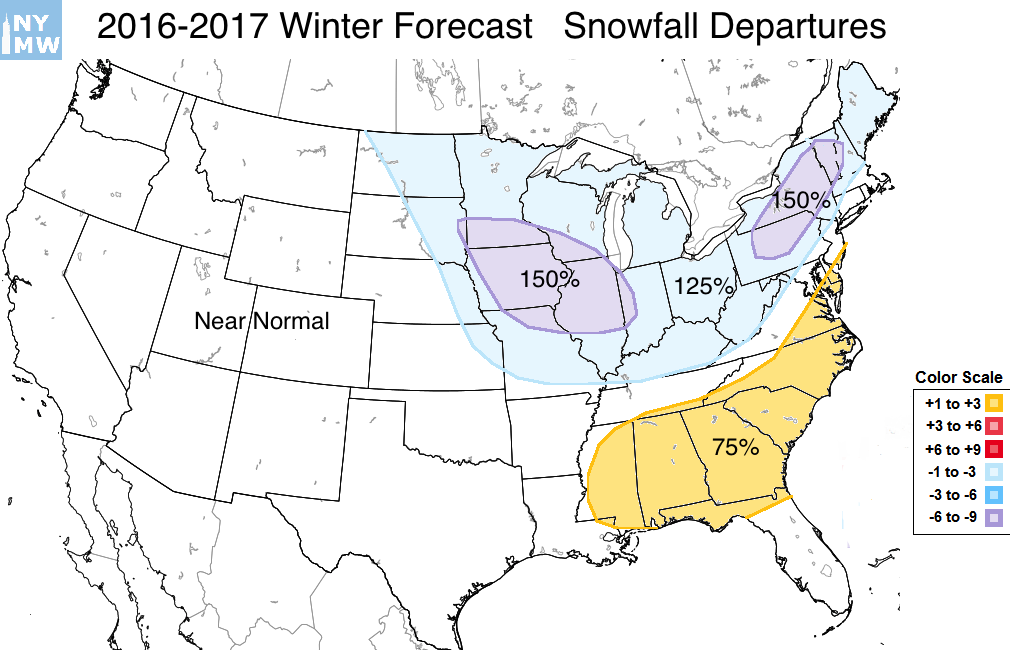
Snowfall Overview and Highlights
While snowfall forecasting in terms of percentages and numbers is inherently difficult at this range, there are some general areas that can be highlighted for departures at this juncture. Namely, an active storm track during the first half of the Winter is expected to benefit the Interior Northeast and parts of the Great Lakes states. Multiple disturbances and winter storm opportunities should bring snowfall between 125%-150% for these areas for the DJF trimonthly period. Lake Effect Snow is also expected to be fairly significant with multiple shots of cold air.
In addition, a below normal anomaly near 75% of normal snowfall is expected throughout the Southeast. The presence of the Southeastern US ridge is expected to be particularly inhibitive of snowfall as the season draws on throughout these areas. The rest of the country seems likely to fall within the typical margin of error for normal snowfall.
NYC-Focused Winter Highlights
December Temperature Anomalies: -1 to -3 F (Below Normal)
January Temperature Anomalies: 0 to +1 F (Slightly Above Normal)
February Temperature Anomalies: +3 to +5 F (Much Above Normal)
Snowfall Departure From Normal: 100-125% (Slightly Above Normal)
A faster start to the winter is expected in the NYC Metro Area, especially when compared to the past several which have generally started slower. Winter storm opportunities will be plentiful early on, especially in the interior and higher elevations. As discussed above, a gradual transition to warmer conditions are expected by the middle of January across the East, and the NYC Metro Area will be no exception. While some winter weather opportunity may return in March, the second half of the winter seems likely to be warmer and less snowy than the first.