-2")
NYC Winter Forecast 2020-2021 | Warmer, less snowy than normal
The Winter of 2020-2021 is likely to feature warmer than normal temperatures in the NYC Area. NYC’s 30 year average annual snowfall is 28.9″, and we expect less than average snowfall during this upcoming winter season.
Click here to jump to the forecast maps
Click here to jump to the forecast data
We say it every year, but it’s worth repeating: Seasonal weather forecasting is one of the most challenging aspects of meteorology. It is the product of several months of intensive research, which often begins in the prior Spring. We’ve been piecing together ideas for this upcoming winter since then, and we are excited to finally have a finished product.
Instead of focusing on individual numerical indexes and values, we are going to try to paint a picture of the atmosphere and what it will be doing over the next few months – based on several global and hemispheric oscillations, conditions, and phenomena. This will lead us to the conclusions which we believe will be the guiding forces for us during the seasons ahead.
The role of ENSO
Anticipated ENSO Conditions: Moderate or strong La Nina
ENSO conditions are one of they key drivers to the Winter pattern. “Tropical forcing” refers to concentrated areas of showers and thunderstorms, otherwise referred to as convection, in meteorological regions of the tropics. This convection, most frequently observed in warm and moist climates, releases latent heat that then rises up into the atmosphere, forming ridges of higher atmospheric air pressure.

The equatorial waters of the Pacific ocean that comprise the ENSO regions breed a great deal of convection, which then accordingly results in atmospheric ridging, and subsequently moves downstream, balancing the atmospheric regime. In a general sense, the more anomalous the positive sea surface temperature anomalies, the more convection that can then exert a stronger forcing mechanism on the adjacent regions of the atmosphere, reverberating throughout the globe.
Almost all forecast model guidance now agree that we will experience a moderate or strong La Nina during the upcoming winter. La Nina conditions are observed when colder than normal temperature anomalies exist in the aforementioned tropical regions of the Pacific Ocean.
La Nina events can be broken down into subcategories separate from their strength, based on location. The most frequently observed types of La Ninas are “central based”, when the coldest anomalies are in the central Tropical Pacific and “east based”, when the coldest anomalies lean eastward, closer to Central and South America in the eastern tropical Pacific.
This year, the coldest anomalies and subsurface cool areas are located between the central and east based Nina regions. The regional bias of the Nina is therefore described as “varied”. This is an important distinction. ENSO can be a major pattern driver, and its location has major implications on the resultant global circulations. Central and east based La Nina’s behave quite differently, and factoring in “varied” conditions was challenging.
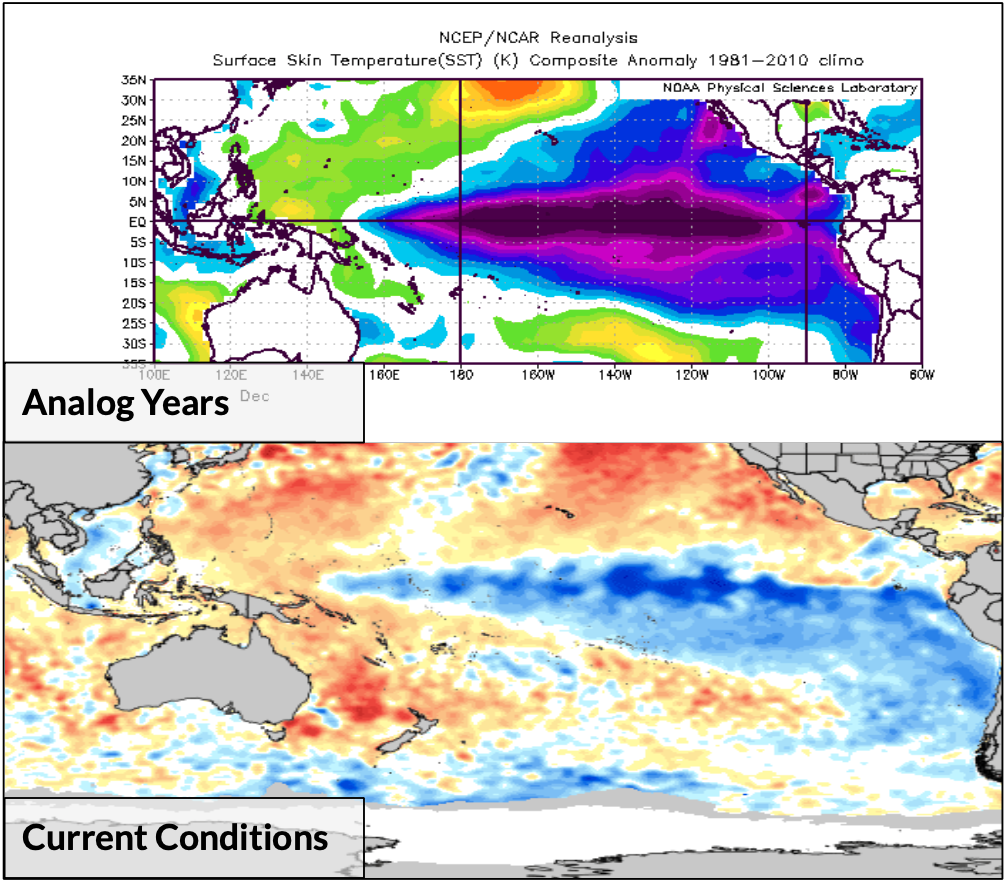
Using a weighted analog set featuring mixed/variable La Nina events of at least moderate strength, we are able to compile an analog set of the SST anomalies in the Tropical Pacific. This analog set matches quite closely with ongoing and expected conditions.
This analog set is important. It helps us to understand where we are heading during the winter ahead and how global circulation patterns may behave. Having confidence in the orientation of SST anomalies in the Tropical Pacific is a key part of the winter forecast and serves as a foundational piece of the forecast as a whole.
The Quasi-Biennial Oscillation (QBO)
Prediction: Westerly QBO
The QBO is a very important atmospheric index which monitors the quasi periodic oscillation between the equatorial zonal wind – from easterlies to westerlies. A negative QBO often supports higher latitude blocking and ridging, while a more positive QBO supports some resistance to high latitude blocking in those areas.
Recently, a positive (westerly) QBO has been observed. This is an important factor in the Winter ahead, especially given the understanding that La Nina events tend to feature Southeast US ridging overall. Think of it this way – if ridging is favored by tropical forcing, and high latitude blocking is less likely with a westerly QBO, the chances of resisting ridging and warmth drop even further.
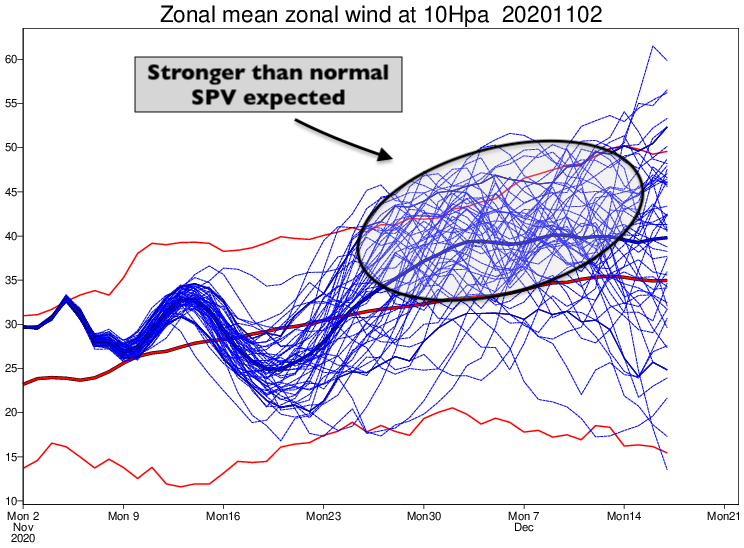
With a westerly QBO in place, it will become important to closely monitor the progression of the stratospheric polar vortex. After starting the season weaker than normal, the stratospheric polar vortex (SPV) has strengthened and is expected to strengthen further.
The North Atlantic Oscillation (NAO)
Prediction: Positive (+NAO) on average
The North Atlantic Oscillation (NAO) is an index based on the surface sea-level pressure difference between the Subtropical (Azores) High and the Subpolar Low. The positive phase of the NAO reflects below-normal heights and pressure across the high latitudes of the North Atlantic and above-normal heights and pressure over the central North Atlantic, the eastern United States and western Europe. The negative phase reflects an opposite pattern of height and pressure anomalies over these regions.
A negative NAO is associated with colder, more active conditions in NYC during the winter months. A positive NAO is correlated with warmer conditions overall. This year, we are expecting the NAO to average more positive during the winter months. The majority of our analog years also featured similar conditions.
With a westerly QBO in place and a stronger than normal stratospheric polar vortex anticipated, high latitude blocking that leads to -NAO conditions may be hard to come by. Periods of blocking currently appear most likely during the month of December, and less likely during the months of January and February.
Other Factors (PDO, Solar Activity, etc)
There are many other factors that go in to producing a Winter Forecast. We try to weight and balance our forecasts based on a variety of subjects. For example, this year the PDO (Pacific Decadal Oscillation) is at -0.50, but is displaying some characteristics more typical of a +PDO. Solar activity is emerging from a near 10-year minimum. The QBO has been behaving oddly. You get the point – all of these things tie back to the proper weighting of analogs to get an idea of exactly how the atmosphere is behaving.
Analog years are an important component to winter forecast development. Looking back to past years that featured similar atmospheric progressions and conditions can offer us a peek into how things may evolve in the winter ahead. We can appropriately weight these based on our understanding of the atmosphere during those years and how it compares to current conditions.

The usage of analog years in a Winter Forecast has been long debated and discussed. How much should a forecaster weigh what happened in the past against what is happening currently? How can we utilize past events when the atmosphere is almost certain to behave differently each time, especially given the difference in global weather when compared with weather events from the 1950’s and 1960’s?
For us, each winter is different. This year in particular, the number of analog years that fit the set of conditions and the overall progression of the atmosphere is very slim. There are simply very few years that featured a variable La Nina state with moderate to strong intensity and also fit the pattern across the rest of the globe.
With that in mind, we decided to weight the analog years in our forecast very carefully, taking only the stronger year(s) and blending quickly downward toward the weaker analogs. We are comfortable with our analog composites that were presented and have factored them into our forecast as we typically do – simply a piece of the larger forecasting puzzle.
When we take the individual pieces of research and compile them into one organized forecast, we can begin to see the ebbs and flows of the winter ahead – as they should be, according to our very best analogs and subset of current and past conditions. This winter, we are confident in our month-to-month composites and have indicated moderate to high confidence on each month.
Below, we break down each months temperature and anticipated precipitation trends. While precipitation maps are not included (lower confidence) we discuss precipitation pattern and potential within each individual months breakdown. Please keep in mind, this is a NYC Winter Forecast, but we do discuss national trends and weather patterns as well!
December 2020

The month of December is expected to offer the most wintry intrigue of the season in the Northeast United States. Most notable, it appears likely that active conditions could occur with temperatures near or slightly below normal in New England.
High latitude blocking may re-appear during this month, allowing cold air from the Arctic to be pushed into Eastern Canada and New England. It remains unclear how long this high latitude blocking will last, and where it will be oriented, but confidence is high enough to suggest that temperatures will average below normal in the Northeast as a result of its development.
It may appear, for a time, that winter is off to a fast and wintry start in New England as December evolves. We expect that will be a mirage.
January 2021

The month of January 2021 is expected to feature a volatile weather pattern across the United States. In New York City, we expect temperatures to average a few degrees above normal. Much warmer than normal conditions are expected to our south, in the Mid Atlantic States.
The coldest air relative to normal in the country will lie in the North Central Plains, Upper Midwest and parts of the Great Lakes. An active storm track should bring several opportunities for snow to these regions, and occasionally parts of New England.
NYC is more likely to lie on the warm side of these storms, with perhaps some wintry precipitation at the onset and several wintry mix and rain events.
February 2021

When we mentioned that December’s wintry weather would be a mirage, we were not kidding. After warmth in January, we anticipate even more anomalous warmth in February as a large Southeast Ridge develops and warmer than normal air floods the Eastern United States.
The coldest air relative to normal in the United States will again lie in the North Central Plains, and wintry weather is expected to continue in parts of the Upper Midwest and Great Lakes.
Closer to home in NYC, we anticipate warmer than normal conditions and less opportunities for snow than normal throughout the month.
NYC Winter Forecast 2020-2021 Highlights
Temperatures: Warmer than normal (+2 to +4)
Precipitation: Wetter than normal
Snowfall: Less than normal (15-20″)
Winter 2020-2021 is expected to begin with somewhat active and perhaps wintry conditions in the month of December. By the time we move in to January, we anticipate a transition to warmer weather. February looks like the warmest and least wintry month of all.
We wanted to take the time to thank you for reading our Winter Forecast. It is not lost on us how special it is that so many folks take the time to read what we have to say. Each year, we are fortunate enough to produce and release a Winter Forecast both to clientele and to the public. We are grateful for the opportunity to share our forecast with as many people as we can – and we hope to have delivered a forecast that provides detail, information and clarity.
The forecast was compiled at Empire Weather, LLC and New York Metro Weather, LLC in Fanwood, New Jersey from May of 2020 through November of 2020. The graphics were compiled by John Homenuk. Analog work and composition was completed by John Homenuk, Ed Vallee, Doug Simonian and Steve Copertino. Additional forecast feedback, commentary and production was provided by Miguel Pierre.
Cheers to a wonderful Winter ahead!
Good write-up, I’m regular visitor of one’s blog, maintain up the excellent operate, and It’s going to be a regular visitor for a long time.
Big fat goose egg on this prediction, eh? Good one. It has snowed every other day for months sometimes feet at a time. You’re really bad at your job.