-2")
NASA rocket launch to the Moon will be visible from NYC tonight
A historic rocket launch will take place tonight from the NASA Wallops site in the eastern shores of Virginia. This will be first rocket launch out of the Earth from this site.
Although the best views will be in Virginia, Delaware, and Maryland, the entire NYC Metro area will still be close enough to get a great view of it. The best view is expected to be around 11:27 p.m. tonight, which is when the rocket will launch. This will be the time to look to the south.
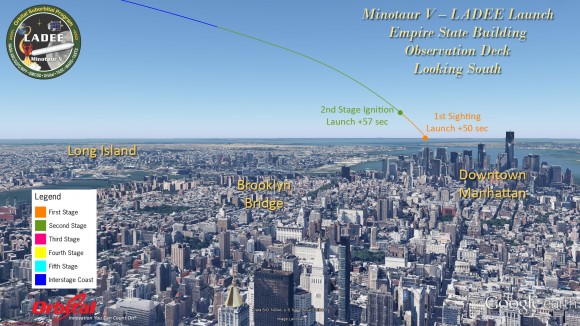
An image illustrating the viewing scheme of the rocket, taken from the perspective of someone on the Empire State Building viewing deck. Image credit goes to universetoday.com
Some of you may be concerned about the tall buildings obscuring the view of the rocket. However, that should not be an issue, given the close proximity of NYC. The rocket will be high enough above the horizon for all to see. Additionally, skies look to be clear tonight, making for great conditions to see the rocket.
The first sighting will be to the south, near the horizon, around fifty seconds after the launch. The rocket will then appear higher above the horizon shortly after, and then continue to get higher above the horizon, but at a slower rate (a logarithmic curve).
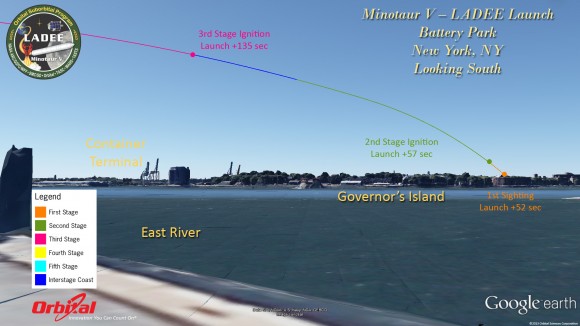
An image illustrating the viewing scheme of the rocket, taken from the perspective of someone in Battery Park. Image credit goes to universetoday.com
After a few minutes, the rocket will be out of our field of view. Once again, anyone who wants to see it will need to be prepared at promptly 11:27 p.m., and look to the south!
For more detailed information on the rocket launch, check out this link. It turns out that almost all of the northeast will have some sort of view of the rocket.
Enjoy your night, everyone!