“The best snowfall accumulations should be relegated to areas North and West of 287 in New Jersey.”
For anyone who has been around meteorology, public forecasting, or snowfall forecasting in the media and television over the last 10 or more years, this has been a phrase which will ring many bells and bring back many memories. The media, news outlets, and other forecasters have used the saying of sorts as a way to discern where the higher snowfall totals may occur over the hills and elevated areas of interior Northwest New Jersey. Whether it be via cooler temperatures at the surface, aloft, or a longer duration event in general, it seems that areas North and West of 287 often benefit from their location and elevation in winter storms.
With winter only a few short months away, and the first murmurs beginning in our offices about winter forecasting and seasonal forecasting, the saying brought up a few questions — and the potential for some research. Is “North and West of 287” a generalized phrase, or can it actually be used to differentiate between parts of New Jersey which receive more snow than others? We took a look into the location of I-287 in New Jersey compared to storm specific, seasonal, and long term snowfall averages and found some very surprising results.
https://www.nymetroweather.com/wp-content/uploads/2024/02/Empire-2000-x-300-px-2.png00John Homenukhttps://www.nymetroweather.com/wp-content/uploads/2024/02/Empire-2000-x-300-px-2.pngJohn Homenuk2013-09-17 14:35:292013-09-17 15:24:46North and West of 287: Not just urban legend?
A historic rocket launch will take place tonight from the NASA Wallops site in the eastern shores of Virginia. This will be first rocket launch out of the Earth from this site.
Although the best views will be in Virginia, Delaware, and Maryland, the entire NYC Metro area will still be close enough to get a great view of it. The best view is expected to be around 11:27 p.m. tonight, which is when the rocket will launch. This will be the time to look to the south.
An image illustrating the viewing scheme of the rocket, taken from the perspective of someone on the Empire State Building viewing deck. Image credit goes to universetoday.com
Some of you may be concerned about the tall buildings obscuring the view of the rocket. However, that should not be an issue, given the close proximity of NYC. The rocket will be high enough above the horizon for all to see. Additionally, skies look to be clear tonight, making for great conditions to see the rocket.
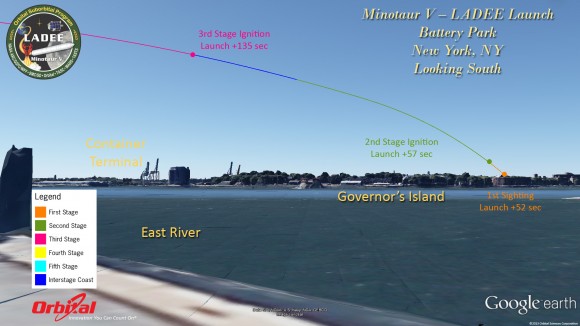
The first sighting will be to the south, near the horizon, around fifty seconds after the launch. The rocket will then appear higher above the horizon shortly after, and then continue to get higher above the horizon, but at a slower rate (a logarithmic curve).
An image illustrating the viewing scheme of the rocket, taken from the perspective of someone in Battery Park. Image credit goes to universetoday.com
After a few minutes, the rocket will be out of our field of view. Once again, anyone who wants to see it will need to be prepared at promptly 11:27 p.m., and look to the south!
https://www.nymetroweather.com/wp-content/uploads/2024/02/Empire-2000-x-300-px-2.png00Doug Simonianhttps://www.nymetroweather.com/wp-content/uploads/2024/02/Empire-2000-x-300-px-2.pngDoug Simonian2013-09-06 17:51:222013-09-06 17:57:47NASA rocket launch to the Moon will be visible from NYC tonight
Global climate change has been a pretty hot topic in the world of meteorology and climatology for quite some time now. Skeptics and pro AGW (Anthropogenic — meaning human as opposed to natural — Global Warming) have raged on and on. One of the main components that people like to look at to track the degree of warming is the amount of Arctic Sea Ice loss. As the calendar slides through August and into September, we get closer and closer to the minimum ice extent for the year, before recovering for the fall and winter. Arctic Sea Ice has really declined in the past several years — potentially due to AGW, as the amount of loss last year was absolutely staggering. In fact, the entire 2007-2012 period saw unprecedentedly low levels of Arctic Sea Ice that led many to become quite worried about this being the new normal.
Most global climate simulations indicate that the area of greatest warming would be in the Arctic — mainly because it is easier to heat something that is cold than what is hot. Decreasing the amount of Arctic Sea Ice could lead to lots of devastating climate feedbacks on the Earth’s system, such as a lot less radiation being deflected back into space, and further yielding warming. This is because ice and snow have a higher albedo (ability to reflect heat radiation back into space) than water. Thus, a warming arctic –> more water and less ice & snow –> lower albedo in the arctic –> less heat radiation is reflected back into space (and is instead absorbed by the water) –> warming arctic. This means that the feedback helps to amplify the original effect of warming the arctic, without increasing the warming effect itself.
When the Artic regions are quite warm, this is obviously bad for many ecosystems alike. But it would also greatly alter the weather patterns in that it would change the jet stream configuration, since if you are warming the Arctic a lot more than the equatorial latitudes, you are decreasing the temperature gradient between the two, which is what fuels the jet stream to begin with. There are a lot more climate feedbacks and such, but to save time, we won’t get into that for now.
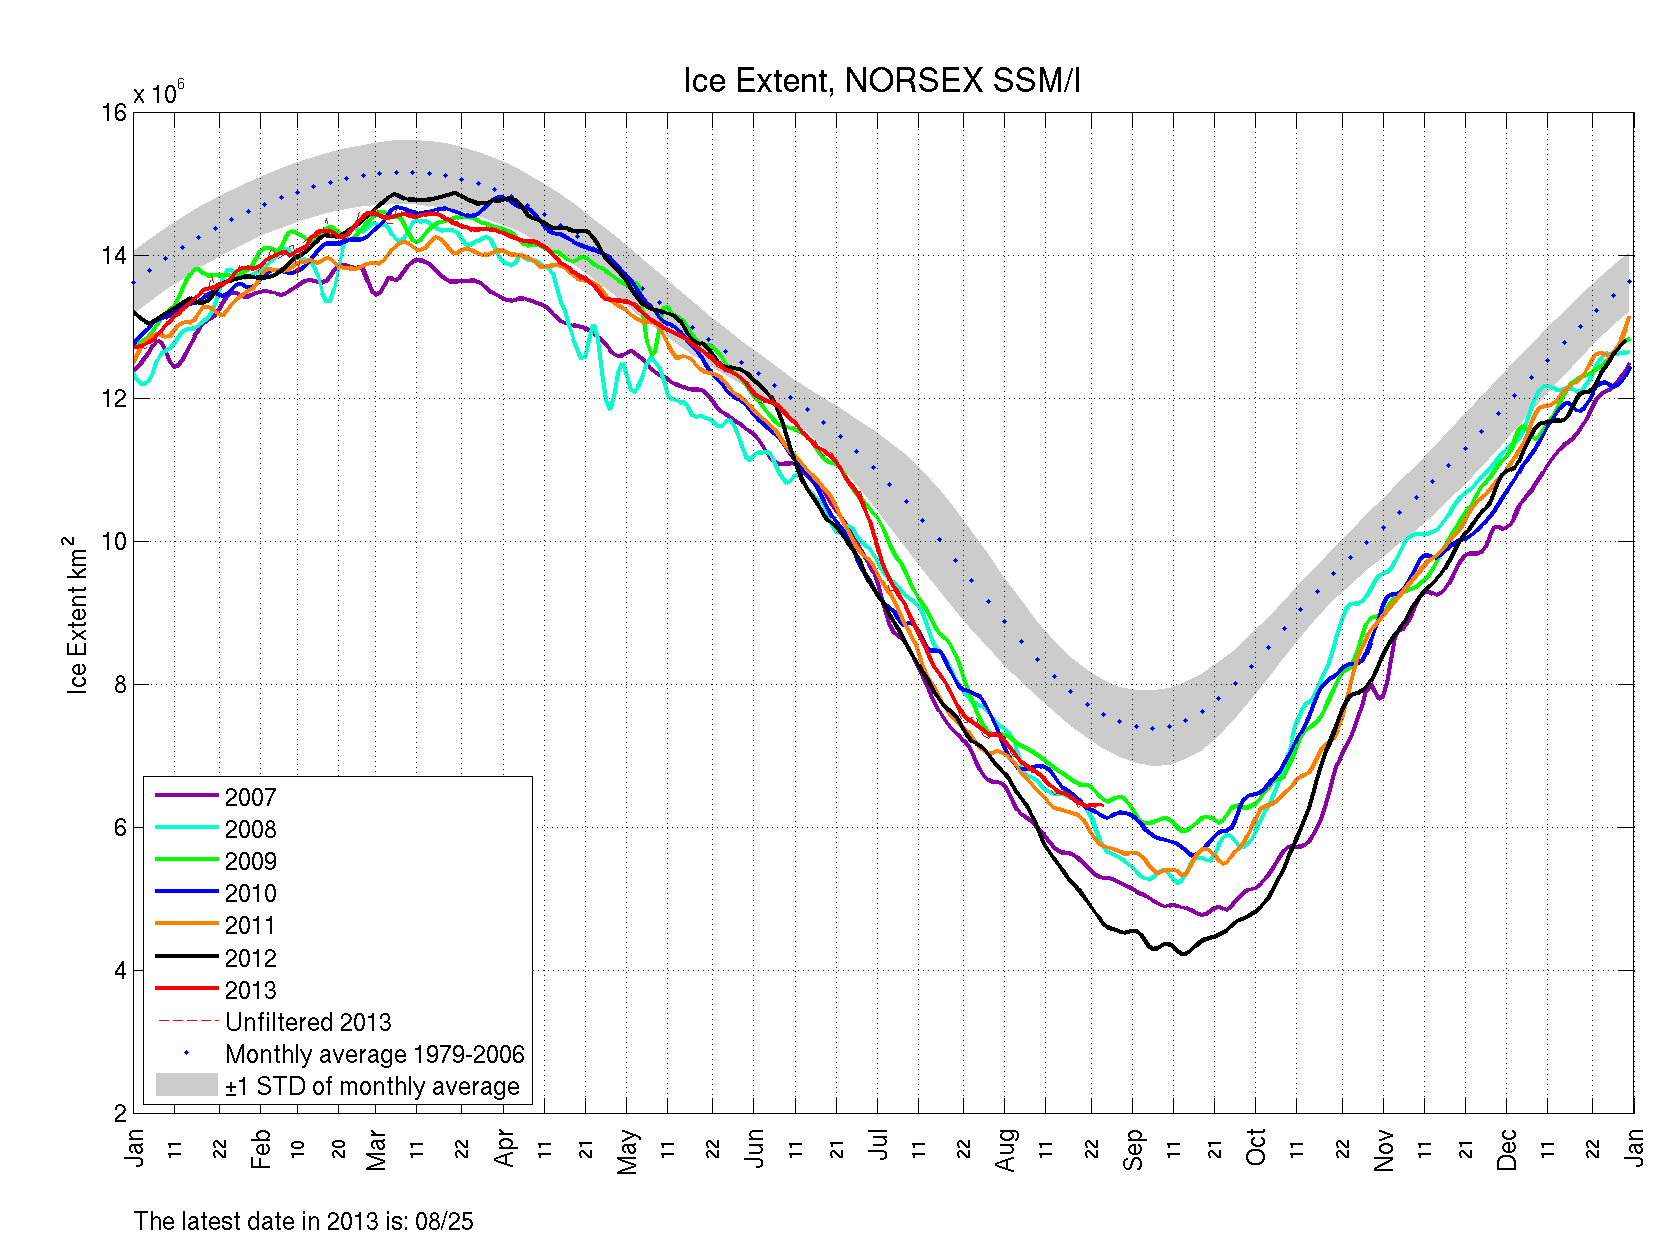
Figure 1: Arctic Sea Ice extent from this year (red) is much higher than from last year (black). However, it is still well below the 1979-2006 averages.
Arctic Sea Ice can be measured in two ways: ice extent and ice area. The National Snow and Ice Data Center explains the differences well here, but essentially, the analogy is swiss cheese. Extent would be the distance from the edges of the cheese and all of the space inside the edges — so it does not include the holes, whereas the area takes the holes into account. There are pros and cons to using each method, but the NSIDC uses extent.
The chart above shows the Arctic Sea Ice extent from the past several years, in comparison with the 1979-2006 averages. Obviously, we are still well below the 1979-2006 averages, so it is not time to “cancel” global warming. However, we have had a very significant recovery from this time last year — it is almost two million square kilometers above last year’s level! This is great news. Although we are really only near the 2009 level and not necessarily that deviant from the past several years, the increase is quite significant and a bit unprecedented, since year-to-year increases of this magnitude are rare.
https://www.nymetroweather.com/wp-content/uploads/2024/02/Empire-2000-x-300-px-2.png00Doug Simonianhttps://www.nymetroweather.com/wp-content/uploads/2024/02/Empire-2000-x-300-px-2.pngDoug Simonian2013-08-27 13:32:012013-08-28 00:43:24Arctic Sea Ice Loss Not Nearly as Bad as Last Year
If you have spent any time at all visiting the shores of New Jersey or New York this summer, you’ve probably left with one thing on your mind: that water was entirely too cold! The bad news is, it’s not all in your head. The waters are actually cold — and colder than normal for this time of year on a local scale. The good news is that a changing pattern will help to warm the waters with time over the next few weeks. The question that remains, though, is: What is causing the uncomfortably cold ocean waters?
The answer: Upwelling. Sounds complicated, but it actually is a fairly simple process. Winds that blow across the oceans surface push the top layer of warming water away. The water then rises up from beneath the surface to replace the water that was pushed or “blown” away by the winds. The waters below are typically much cooler, and so the water that rise to the surface is chilly. Upwelling events over the past few weeks along the shores of Maryland, Delaware and New Jersey have left beachgoers shivering.
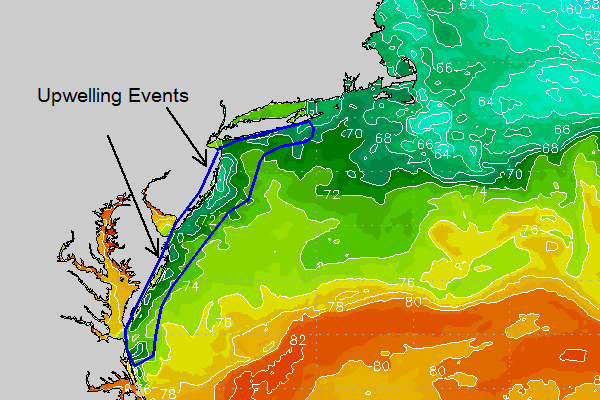
Regional Sea Surface Temperature data shows a local pocket of cooler waters, owing to upwelling which has occurred along the areas shoreline.
A glance at the regional or local sea surface temperatures reveals the upwelling which has occurred near and long the Mid-Atlantic coasts. There are various things at play on the above sea surface temperature map. You can see warm ocean waters along the Gulf Stream (bottom right), cooler waters in the Northwest Atlantic near New England, and the local upwelling events keeping the waters cooler than surrounding areas. The Atlantic as a whole is running above average — with our cool waters classified as a very localized event.
Over the next few days, a more onshore flow is forecast to develop. This is important, as the changing wind direction will help to moderate the water temperatures — albeit slowly. Those of you headed to the beach over the next week or two should certainly take that as welcomed news.
Hi friends! Our website uses cookies to provide an optimal browsing experience for you. New "Cookie Consent" laws mandate us to inform you of this. As long as you're cool with it, just hit OK. You'll only see this message once.
We may request cookies to be set on your device. We use cookies to let us know when you visit our websites, how you interact with us, to enrich your user experience, and to customize your relationship with our website.
Click on the different category headings to find out more. You can also change some of your preferences. Note that blocking some types of cookies may impact your experience on our websites and the services we are able to offer.
Essential Website Cookies
These cookies are strictly necessary to provide you with services available through our website and to use some of its features.
Because these cookies are strictly necessary to deliver the website, refusing them will have impact how our site functions. You always can block or delete cookies by changing your browser settings and force blocking all cookies on this website. But this will always prompt you to accept/refuse cookies when revisiting our site.
We fully respect if you want to refuse cookies but to avoid asking you again and again kindly allow us to store a cookie for that. You are free to opt out any time or opt in for other cookies to get a better experience. If you refuse cookies we will remove all set cookies in our domain.
We provide you with a list of stored cookies on your computer in our domain so you can check what we stored. Due to security reasons we are not able to show or modify cookies from other domains. You can check these in your browser security settings.
Other external services
We also use different external services like Google Webfonts, Google Maps, and external Video providers. Since these providers may collect personal data like your IP address we allow you to block them here. Please be aware that this might heavily reduce the functionality and appearance of our site. Changes will take effect once you reload the page.
-2")