Potential for Late Season Freeze

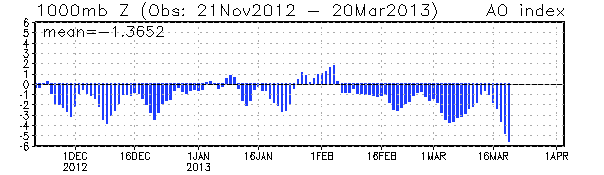
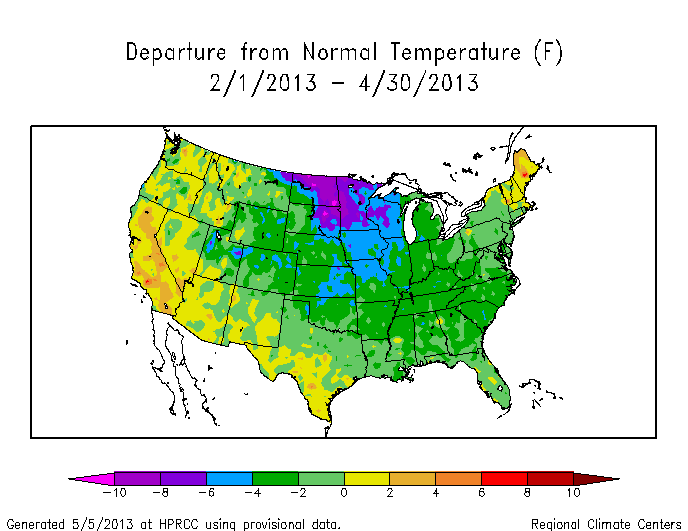
One of the coldest springs in recent history nationwide continues to roll forward with the potential for one more shot of winter across the Mid-west and Northeast. Since February 1st, we have seen a dramatic reversal in temperature anomalies from the blowtorch Dec-Jan period to the very cold Feb-Mar-April of 2013. The only mild areas have been northeastern New England and the SW US – all other locations have been feeling the chill. The epicenter of this cold has been the Mid-west and northern Plains, where many stations experienced over a 20 degree decrease in mean temperature from March 2012 to March 2013:

Last3mTDeptUS

[column size=”one-fourth”]

Chicago  IL:    -27.7º

2012: 64.0º

2013: 36.3º

[/column]
[column size=”one-fourth”]

Des Moines IA: -26.0º

2012: 64.4º

2013: 38.4º

[/column]
[column size=”one-fourth”]

Indianapolis IN: -25.3º

2012: 66.5º

2013: 41.2º

[/column]
[column size=”one-fourth” last=”true”]

La Crosse WI: -27.5º

2012: 59.4º

2013: 31.9º

[/column]


[column size=”one-fourth”]

Marquette MI: -24.3º

2012: 50.6º

2013: 26.3º

[/column]
[column size=”one-fourth”]

Milwaukee WI: -26.3º

2012: 59.1º

2013: 32.8º

[/column]
[column size=”one-fourth”]

Minneapolis MN: -25.2º

2012: 56.3º

2013: 31.1º

[/column]
[column size=”one-fourth” last=”true”]

St. Louis MO: -22.1º

2012: 70.4º

2013: 48.3º

[/column]


The month of May began with similar magnitude of cold in the same areas that have been targeted over recent months. Brutal, recording breaking cold encompassed the Plains, with the historic event of snow flakes flying as far south as Arkansas. The coastal Northeast has been near normal with a northeasterly flow off the Atlantic, but surface high pressure made the airmass a beautiful, dry, sunny one for us. The interior Northeast and OH Valley have been much warmer the past week, though that will change for a time next week.

Read more

Does blocking in May hint at summer weather?

Seasonal forecasting is one of the more tedious and intricate tasks for meteorologists. Not only is it difficult to predict by nature (no pun intended) — but forecast model accuracy skill is greatly reduced at that range. Often, meteorologists find themselves looking back towards past events, and analogs, for help with predicting the months ahead. In our case, interest was piqued when we noted what seemed to be higher than normal frequency of high latitude blocking this year. Hurricane Sandy, the nor’easter which immediately followed, and many events this winter featured patterns that were driven by blocking patterns over Canada, Greenland, and the higher latitudes towards the pole. The blocking pattern was not overly anomalous at least on a per-year basis, but it certainly seemed to be more frequent than the calendar year which preceded it.

As we look forward to May, forecast models are in agreement on the continuation of higher than normal height anomalies at 500mb over Central and Eastern Canada as well as farther north towards Greenland. The continuation of blocking in the higher latitudes, relative to our location, can offer some interesting insights into the summer temperature forecast as we move forward. Is there a common theme amongst the historically warm and historically cool summers in the NYC Area — and can we relate it to Springtime blocking patterns? The answer, may surprisingly to some, is yes.  For the sake of example, take the summer of 2009 and the summer of 2010. Both of these years featured wildly different patterns, with 2009 remaining very cool throughout the summer while 2010 was warm. In 2009, there was very little blocking observed from March through May. 2010, on the other hand, featured periodic blocking in the high latitudes from February through May. Interested yet?

Read more

To Spring or not to Spring? That is the Question.

Upon waking up to another chilly morning, most of us are probably wondering when Spring is coming. For those west of NYC, it probably arrives on Monday and Tuesday, but for those east of New York City, we might have to wait until April 15th or so. Forecast models are struggling immensely with the positioning of a warm front for next week, which throws lots of wrenches into the forecast.

A storm system will head up the coast on Friday and shoot into the Canadian Maritimes this weekend, and strengthen as it does so. That will help to keep things relatively chilly for the weekend, with the cooler northerly flow behind it. Once that storm system gets far enough to our north, heights will begin to rise, and this is when the potential warm-up begins. This is also when the European model and the GFS model really begin to diverge. The biggest difference is the way they handle a huge upper level low in Canada. The GFS splits the ULL into two and elongates it, while the Euro keeps it one large entity that dominates the pattern. The differences begin as soon as 84 hours (Sunday morning), as the GFS is already showing signs of splitting the feature and elongating it, while the Euro is much more powerful. Implications of this will be explained shortly.

The 00z Euro has the ULL as a much more powerful feature.

The 00z Euro at 84 hours has the ULL as a much more powerful feature.

The 00z GFS at 84 hours is splitting the ULL and elongating it.

The 00z GFS at 84 hours is splitting the ULL and elongating it.


One thing we do know is that it is clear that there are still remnants of the past blocking pattern in place. There are cutoff portions of very high heights in northern Canada; thus favoring closed off ULLs to form downstream. These patterns do not tend to run very warm, but the good news is that the core of the blocking for the most part is oriented a bit to the west of the NAO regions. Both models agree on a vigorous shortwave entering the Pacific NW, but it will not be allowed to race eastward, due to the ULL and the blocking. Thus, it is instead forced southward, underneath the block.
Read more

AO Falls to lowest value ever for Mid March

The Arctic Oscillation readings over the last several months show the dramatic and unrivaled drop in readings during mid March 2013.

The Arctic Oscillation readings over the last several months show the dramatic and unrivaled drop in readings during mid March 2013.

The Arctic Oscillation (AO) has fallen off the cliff in the last week, as incredible high latitude blocking ridges have developed both north of Alaska and over Greenland. The AO fell below -5.0 to -5.632 on March 20th, 2013 — making it by far the lowest reading after March 15th in the history of the AO’s recorded values. It also remains, historically, the lowest AO after March 6th.

GFS Model observed (black) and forecast (red) AO values

GFS Model observed (black) and forecast (red) AO values

The Arctic Oscillation, or AO, refers to the generally opposing pattern between pressure in the northern-middle latitudes and the Arctic. It is a climate pattern, that is characterized by counterclockwise winds which circulate around the Arctic near 55°N. The phase and degree of amplitude of the Arctic Oscillation can be a very useful forecasting tool, especially in the winter season. During a positive phase AO, a belt of strong winds circulating around the pole often acts to keep cold air confined to our north. But a negative AO opens the proverbial flood gates for the arctic air to penetrate much farther south.

It should come as no surprise, then, that this strongly negative AO phase has been accompanied by the presence of unseasonably cold air. The forecast, holds the potential for cold air through the next 7 days with chances for snow. The GFS ensemble and most medium range global models forecast the AO to rise over the next 7 days. Although it is typical for the AO to rise and fall rather consistently, the dramatically low values are being accompanied by rather high return values to normal, and in some cases a positive phase of the AO. Regardless, It remains to be seen if the wintry weather threats will work out Still, one thing is for sure: we are in uncharted territory as far as the Arctic Oscillation goes, for this late in the season.

For more on the Arctic Oscilation check out this article, which details the different phases and amplitudes.