“The best snowfall accumulations should be relegated to areas North and West of 287 in New Jersey.”
For anyone who has been around meteorology or public forecasting in the media over the last 10 or more years, this has been a common phrase. The media, news outlets, and other forecasters have used the saying as a way to discern where the higher snowfall totals may occur: Over the hills and elevated areas of interior Northwest New Jersey. Whether attributed to cooler temperatures at the surface, aloft, or a longer duration or wintry precipitation, it seems that areas North and West of 287 often benefit from their location and elevation in winter storms.
With winter underway, and already a few winter storms on the books which featured more winter weather north and west of the interstate, the saying has returned – and brought about the potential for some research. Is “North and West of 287” a generalized phrase, or can it actually be used to differentiate between parts of New Jersey which receive more snow than others? We took a look into the location of I-287 in New Jersey compared to storm specific, seasonal, and long term snowfall averages and found some very surprising results.
Interstate 287 runs through Northern New Jersey, in a bit of a convoluted path from Northeast New Jersey southward before ending in Edison. The horseshoe type path of the interstate creates some issues in terms of the accuracy of any statements claiming that the higher snow totals could be North and West of the highway. By nature, this will vary as the highway’s direction bends and changes over time. So, immediately, the statement cannot be true for all locations that lie to the North and West of I-287. However, an extended area of the highway runs from a southwest to northeast trajectory throughout suburban New Jersey. Beginning in Bridgewater and ending in Bergen County, NJ, it is this part of the interstate that proves to actually be a fair dividing line between average snowfall totals in many different situations.
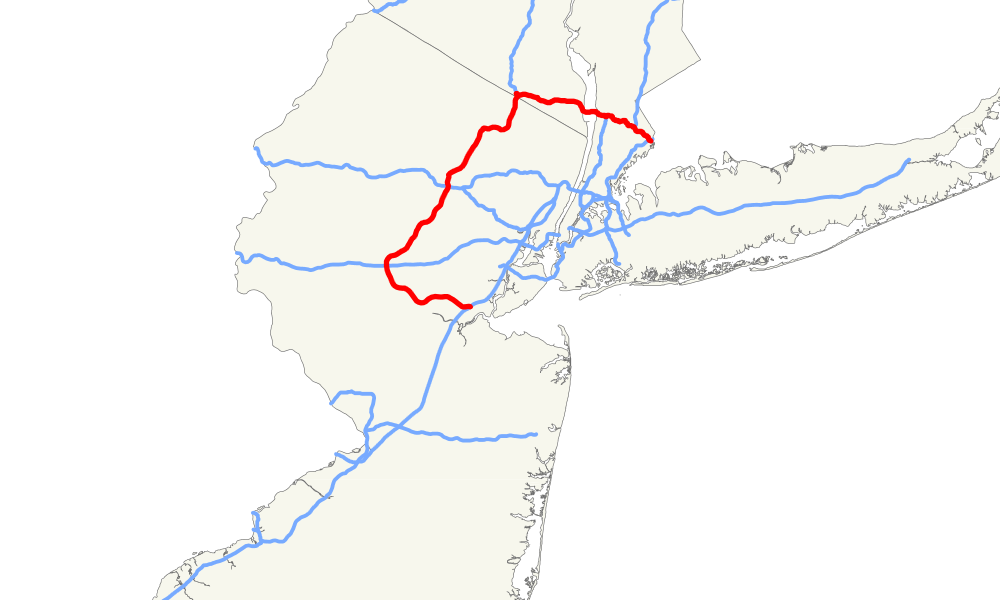
A map highlighting Interstate 287’s path through New Jersey and far Southeast New York.
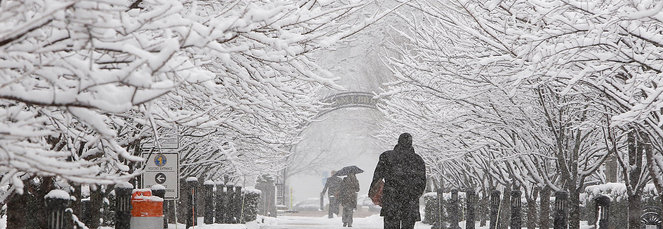
Elevation plays a major role in snowfall and winter storms throughout our forecast area. There are several times per year, when elevated and hillier areas of the interior will see prolonged periods of snow or frozen precipitation while areas nearer to the coastal plain will have flipped over to sleet or plain rain. This has been a common occurrence for years, and has been magnified somewhat during recent “southwest flow” events, where warmer air in the low to mid levels of the atmosphere works in from the southwest during a snowstorm. The coastal plain will change to rain first, while interior and elevated areas will remain frozen for a longer period of time, due to the air remaining cold at the surface. Knowing this, it is safe to say that elevated areas of New Jersey and New York could be at least a moderately good indicator as to where the higher snowfall totals may occur each season.
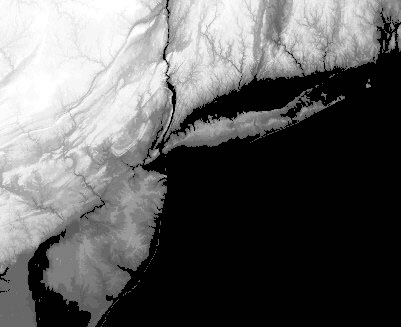
Map of elevation (lighter is higher elevation) in NY, NJ, CT.
Not surprisingly, when comparing the path of Interstate 287 to the more elevated areas, especially in New Jersey, it is easy to see how areas to the North and West of the interstate could have more snowfall than areas to the south and east of the interstate during many different types of winter weather events. In fact, Interstate 287 seems to run directly along an invisible “boundary line”, from southwest to northeast, through Northeast New Jersey that separates the much higher elevations of Morris, Warren, Passaic, and Sussex counties from the lower elevations of Somerset, Union, Essex, Hudson, and Bergen.
The change in elevation is also important, because when the coastal plain changes over to rain, it is often because the winds are coming out of the south, east, or southeast — a marine influence. But the change in elevation, to an extent, can serve to “block” those marine winds from having a true impact on warming the more elevated areas. It’s almost akin to the wind running into a brick wall. The differences are especially magnified in early-season events, when the Atlantic still runs quite warm and coastal areas change over to rain even earlier than usual. Eventually, fast enough winds over a long enough period of time will be able to “climb” the wall and warm the elevated areas. But this lag between the changeovers in coastal areas and more elevated areas can explain a decent portion of the annual snowfall differential.

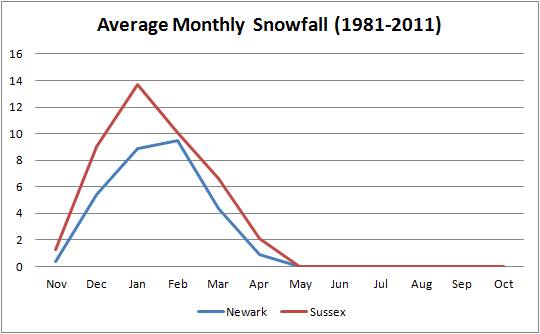
A graph illustrating the monthly snowfall averages from 1981-2011 in Newark, NJ and Sussex, NJ. Notice how the differences between the two are much greater in December and January than in February and March. This is because the Atlantic Ocean is warmer in December and January than in February and March.
Of course, there are areas in particular that see more dramatic impacts from the effects of elevation, or lack thereof, during snowfall events. And in parts of Northern New Jersey, Interstate 287 just so happens to be a perfect dividing line between the two. From Parsippany, essentially all the way north/northeast through Suffern, Interstate 287 acts as an invisible boundary between the elevated areas, which lie to its north and west, and the lower-lying areas, which fall to its south and east. Not surprisingly, users and clients in the area report that the highway is the perfect point of interest to use as a boundary. As one of our contributors from Bergen county put it, “287 is an awesome reference point for Bergen County. I live just NW of 287 in the higher terrain of Bergen. The line is usually a good reference point when determining snowfall, especially in marginal events. Areas west of it average over 500ft, which can make all the difference. I average about 40-45 inches of snow a year, areas to my east see significantly less.”
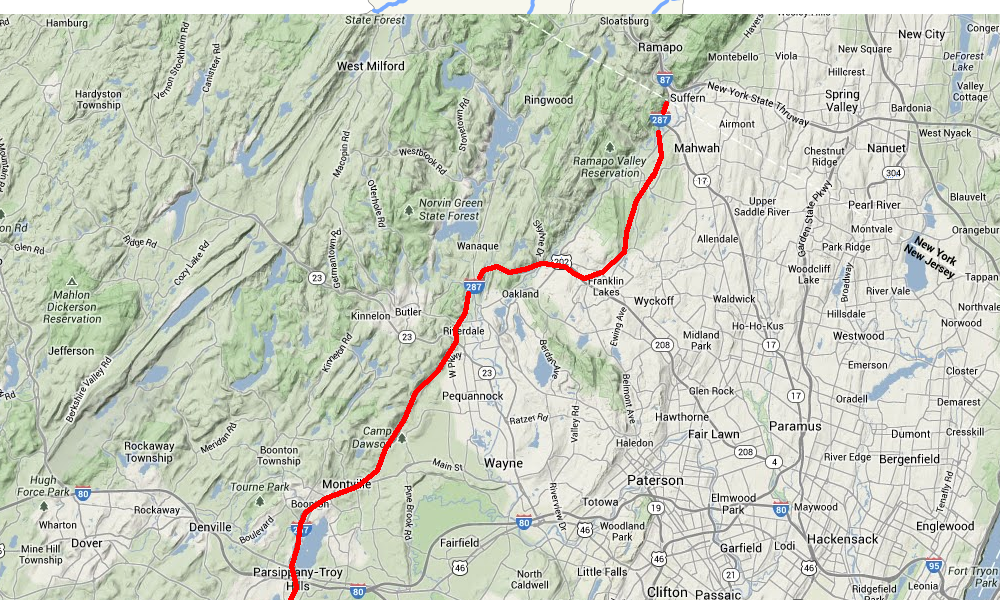
Map of terrain in North/Northeast New Jersey, showing Interstate 287 acting as a dividing line between elevated and non-elevated areas.
When analyzing specific snowfall events, it becomes more evident over time that “North and West of 287” probably isn’t just a saying to throw around, but in fact may have more accuracy than one would think. Just in the past several years, our snowfall event archives offer maps which show the aforementioned boundary very well. The October snowstorm of 2011, January 20th 2012 snowfall event, February 8th 2013 snowfall event and March 2013 snowfall event all featured gradually increasing snowfall from an area that lies generally north and west of the interstate.
All of that said, it is important to remember that on a case by case basis, the location of the highway is irrelevant. It won’t always act as a literal dividing line between more or less snow, or snowier or less snowy winters. In fact, the opposite could be true during some events which feature a more suppressed pattern — and the snowier conditions could be relegated to areas south and east of the highway. But one thing is certainly true. Over time, especially in the last 10 to 20 years, the highway has served as an accurate, but very broad, boundary between areas that receive more wintry conditions (to the north and west of it) than others.
So, while on an individual basis the saying may not always ring true (and this is magnified due to the convoluted nature of the highways path), it is safe to say that over an extended area of Interstate 287 it truly is more snowy to the north and west. Over time, this has proven to be true with seasonal snowfall totals of 40+ inches in New Jersey, while annual snowfall averages drop to 27-30″ south and east of it. It even seems fair to say that the gradient of increase is actually higher going northwest of 287 than any other snowfall increase via northwest movement along the state — which can be tied to the elevation.
-2")