Hurricane Sandy, and her curiously low pressure

One of the most fascinating aspects of Sandy was how strong she was, despite entering cooler waters. Hurricanes have a strong warm core at the surface, weaken with height, and are barotropic — meaning there are no temperature or density gradients in their environment. This means that they are symmetric — their warm core is entirely surrounded by slightly cooler, but still abundantly warm air. The combination leads to them being vertically stacked (not tilted with height). Thus, hurricanes need warm water and weak upper-level winds in order to strengthen. Strong upper-level winds can choke a hurricane’s outflow channel, and advect new airmasses of different temperatures — providing temperature gradients that hinder their development. In further south latitudes, waters tend to be warmer, and the jet stream tends to be weak. As you head further north, however, the water becomes colder and the jet stream strengthens, leading to stronger upper-level winds. This helps to weaken a hurricane’s warm core at the surface, and tilt its vertically stacked structure, weakening the storm. However, as Sandy headed north, she was able to maintain category one hurricane strength with abnormally low pressures and eventually went on to cause widespread devastation. Why?

Sandy was able to maintain strength and deepen as she became a hybrid of a tropical low and an extratropical low. Strong extratropical lows, such as nor’easters, have cold cores at the surface. Instead of being vertically stacked, they tilted towards cold air with height. This means that they are baroclinic; thermal and density gradients exist in their environment, including frontal systems. More specifically, they are asymmetric — with cold air on the west side of the circulation, and warm air on the east side (by definition, a temperature gradient). Sandy was a hybrid in that she had a warm core of strong winds, but was also asymmetrical, meaning her strength was aided by strong upper-level winds and thermal gradients, instead of being hindered by them.

The large trough that phased with and turned Sandy to the west had an abundant source of cold air and strong upper-level winds. There were actually reports of 2-3 feet of snow in West Virginia! That cold air was able to clash with the warmer, tropical air, creating a steep thermal gradient, helping Sandy’s pressures to deepen, despite heading towards colder waters. Additionally, there were several sources of strong upper-level winds that were all co-located in a perfect position for serious strengthening. When forecasters saw these localized areas of strong upper-level winds (also called jet streaks), it was pretty evident that the model solutions which took Sandy to pressures around 940mb at landfall were not off the wall, and were very much possible.

A GFS forecast showed that Sandy was located in the presence of four different jet steaks -- each one favoring a strengthening storm.

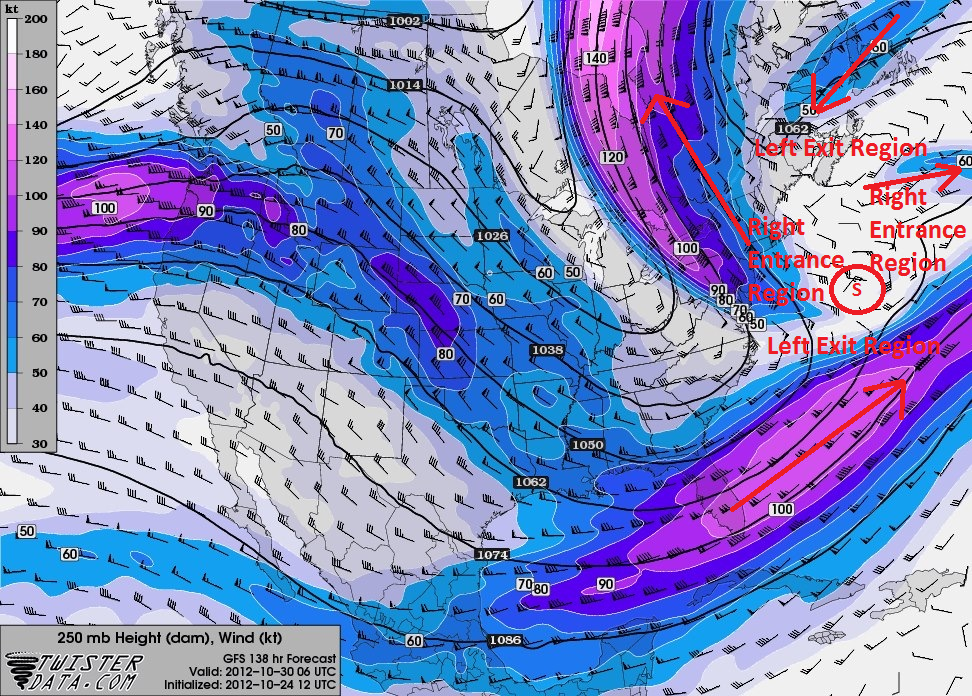
A GFS forecast showed that Sandy was located in the presence of four different jet steaks — each one favoring a strengthening storm. Sandy is denoted with the circle and the “S” inside. The jet streak regions are drawn and labeled as well.

Read more

Could a changing climate mean more Sandy tracks?

The effects of a changing climate on our weather have been debated for years. With each extreme weather event, more people are left wondering whether it can be attributed to climate change or not. After all, many scientists have stated that a changing climate would mean more extreme weather events. However, it is irresponsible to say that every extreme weather event can be attributed to climate change, because that would imply that there was no extreme weather before climate change began.  Remember, the weather is inherently “extreme”, and our daily averages and means are derived from extremes on both sides of the spectrum: hot and cold, wet and dry, and windy and calm. We do not hover around our average highs and lows every single day.

That being said, there may be a link to a changing climate and more extreme weather phenomena, such as the extreme track that “Sandy” took in late October, 2012 — which devastated the lives of many people, and with whom many shoreline communities are still recovering from.

Read more

El Reno, OK tornado becomes widest ever

The National Weather Service has confirmed, after a damage survey, that the tornado which struck El Reno, Oklahoma on May 31st was an EF5 with radar measured winds of 296 miles per hour. Most notably, the tornado reached a maximum width of 2.6 miles, making it the widest tornado ever measured on earth. The wind speeds nearly set a record as well, falling just shy of the strongest winds recorded in a tornado (301 mph, Moore OK tornado in 1999 still maintains the record).

Initially rated an EF-3 on the new Enhanced Fujita Scale, which rates tornadoes from EF0 to EF5, the tornado was upgraded after mobile doppler radar data showed the intense wind speeds of near 300 miles per hour. The winds were measured on mobile doppler radars from two graduate students traveling with the University of Oklahoma. Tornado researcher Howard Bluestein, a professor at the University of Oklahoma put it simply when he said “This is the biggest ever” of the tornado.

Animation of radar data, captured every minute, from Phased Array Radar. Courtesy of Robin Tanamachi.

Four storm chasers were killed in the same tornado, which will certainly become one of the most historic ever for a multitude of reasons. Tim Samaras, Paul Samaras, Carl Young, and Charles Henderson were killed while chasing the storm. Recently, high resolution radar imagery reveals an incredibly impressive structure while the tornado was on the ground, and a debris ball indicated — which takes a dramatic, sharp and sudden turn to the north to a point near where the four chasers were positioned.

For more information on the El Reno, Oklahoma tornado we suggest visiting the National Weather Service in Norman, Oklahoma as well as other local news sources.

20 years later, Storm of the Century remains memorable

Satellite image of the 1993 "Storm of the Century" powering up the East Coast of the United States on March 13, 1993 with a classic "comma head" shape. Courtesy NOAA.

Satellite image of the 1993 “Storm of the Century” powering up the East Coast of the United States on March 13, 1993 with a classic “comma head” shape. Courtesy NOAA.

March 13th marks the 20 year anniversary of one of the most memorable meteorological events ever, the “Storm of the Century”, which moved up the East Coast on March 12-13, 1993. . Twenty years ago today, the “Superstorm of 1993” formed in the Gulf of Mexico (as a very impressive low pressure system) and barreled up the East Coast, eventually leaving historic amounts of snow from the Southeast States through Maine. The system resulted in $9 billion (modern day) in damages and more than 300 deaths. More wildly known as the “Storm of the Century” or “1993 Superstorm”, it remains the highest impact winter weather event to ever affect the Eastern Coast of the United States.

Hi-Res Satellite image of the superstorm as it passed near the NYC Area.

Hi-Res Satellite image of the superstorm as it passed near the NYC Area.

In the immediate New York City Area, the storm featured a wild variety of hazardous weather which likely will not be matched for many years. Heavy snow began around 2am and continued until around 2pm in the NYC Metro Area (longer in the interior). The “Storm of the Century” was the first system to trigger Blizzard Warnings in the New York City Area since 1978.  Near the coast and even in the immediate suburbs, 60 to 75 mph gusts were more than isolated with sustained winds over 30 to 40 miles per hour. By late afternoon, many coastal areas including Long Island saw temperatures reach into the lower 40’s as warm air surged northward. As the storm passed overhead, White Plains, NY measured a record low pressure of 28.38 inches, equivalent to a Category 3 Hurricane. Such pressures are remarkable for our forecast area — but were not surprising given the immense strength of the storm system even as it formed in the Gulf of Mexico. Through the afternoon and evening, heavy rain and strong winds continued to pound the coast while wintry precipitation continued to pound inland areas.

Snow (better defined as “slop” by the time the storm was over) reached the coast as well, with sleet and extremely heavy rain before the system ended. In the suburbs, widespread significant amounts of snow and sleet caused extreme travel difficulties and widespread impacts. As the system raced past the area, cold air began pushing into the area once again by evening. A noted “flash freeze” quickly froze over the slush, slop, and snow into piles of ice, snow and sleet across most of the area.


Read more