Recapping the last two weeks of historic weather

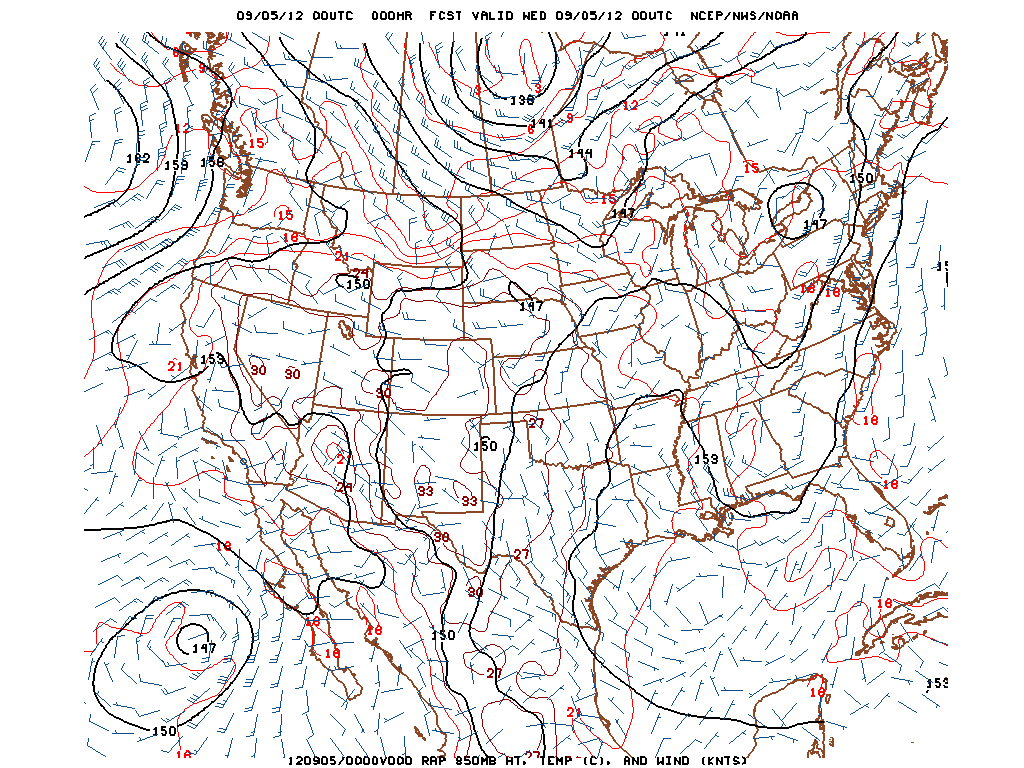
Hurricane Sandy, as she churned up the eastern seaboard on October 28th, 2012.

Often times, especially in the field of meteorology, things can be exaggerated. This becomes especially true when you’re talking about the atmosphere and mid latitude storms — a fluid and dynamic process where some of the most beautiful (and sometimes destructive) systems on earth can form. Your friends, parents, or even grandparents will tell you of the old winters back in the 40’s and 50’s that they lived through which featured 90 inches of snowpack and 150 foot snow drifts. A colleague will detail an awesome thunderstorm which produced beachball sized hail. Or maybe you, yourself, experience a weather event so thrilling that in your words, you exaggerate it a bit to your friends. All of that said, every once and a while, a certain weather event — or a period of time, emerges that cannot possibly be exaggerated. The last two weeks, which we just lived through, is one of them.

As meteorologists, our job is to forecast the weather and inform the public of what the forecast is and how to prepare adequately. It’s a delicate process. Yet, on some days, the process becomes even more delicate than usual. This was the case in during our forecast operations on the afternoon of October 25th, 2012 — just a few days before Hurricane Sandy. Earlier in the week, we had warned of the impending threat in a blog post which read

What catches the long range forecasters eye around Day 5-7 is the forecast development of a tropical system in the Caribbean, which could drift north into the Southeast Atlantic by Day 7. Such a development doesn’t seem overly concerning at first — but the mid and upper air pattern rings some serious alarms for long range forecasters almost immediately. Although variance at this range is a major factor — forecast models don’t usually get a good grip on the pattern for several more cycles — the blocking adds an extra level of intrigue to the pattern development. Should the tropical system head north and not east (also a big question mark) it could be drawn into a phase with the large upper level trough and aforementioned cold front over the Eastern US.

Yet, even with advanced warning, forecasting a storm like Hurricane Sandy is a difficult process. On that afternoon, we were in touch with a significant emergency management corporation. And for the first time as an organization, we told them “this is not a joke. this is a life threatening situation.” This wasn’t a summertime thunderstorm. There were lives at stake — and our forecasts, conferences, and abilities to communicate to our readers could ultimately save lives.

Read more

Sandy Postmortem: Worst Case Scenario?

As we continue the clean-up efforts and power restoration across the tri-state area, let’s take a moment to reflect on the rarity of the storm we just experienced. Over the past couple hundred years, we have seen plenty of hurricanes run up the East Coast, but only a few were comparable to Sandy in terms of her track. What made Sandy so devastating was the angle at which she approached the coast. An extremely anomalous synoptic-set, with strong blocking to our northeast, and an upper trough digging into the mid atlantic, essentially captured Sandy, turning her NW. The upper jet streaks to her south (over the Bahamas) and to her west (over the Appalachains) placed Sandy in a favorable position for intensification – being in the left exit region of one jet streak and the right entrance region of another jet streak. These regions are conducive to upward motion/rising air. Thus, Sandy maintained category 1 intensity (nearing Cat 2 while over the Gulf Stream), and remained a formidable hurricane upon landfall near Atlantic City, NJ, with sustained winds around 80mph.

The largest storm surge in association with hurricanes is always in the right front quadrant of the cyclone. In other words, it occurs to the north/east of wherever the hurricane makes landfall. What made this event so devastating for the Jersey Shore and NY shore was the incredible storm surge from Sandy. Since she made landfall in southern NJ, the worst storm surge was funneled northwest, into the NJ coastline, Raritan Bay, NY Harbor, and Long Island. Surge reached 13.8 ft approximately at Battery Park NY – a record breaking value. Many houses were washed away from the surge.

The strongest winds are also generally located in the right front quadrant of the hurricane – which in this, also occured over eastern NJ, NYC and Long Island. So our area experienced both horrendous storm surge and strong winds. Meanwhile, the heaviest rains tend to occur to the left of the storm track, and we saw that with the 5-10″ rains in PA, DE, MD, and VA. They did not receive as much damage though, due to weaker wind speeds, and virtually no surge. Winds are counter-clockwise around low pressure, so folks on the coast south of Sandy’s landfall — DE, MD, VA, had NWLY winds / offshore flow and thus substantially less storm surge.

Read more

Cleanup Begins After Sandy Hammers Area

Hurricane Sandy slammed into the New Jersey Coast near Atlantic City last night, and brought a ferocity rarely seen from storms systems in this part of the country. The storm was near a record low pressure at landfall at landfall, and the track and intensity brought severe hurricane force winds, heavy rain, beach erosion, historical damaging coastal flooding and storm surge. As the cleanup continues, we step aside but also answer some questions you may have remaining and analyze several pieces of the storm.

Storm Surge: The storm surge began early Monday in Central New Jersey as Sandy was still hundreds of miles southeast of the area. By later Monday, the surge was rapidly pushing sea water into the streets of coastal cities such as Atlantic City, Ocean City, Long Beach Island, and Long Branch. The waters continued to flood into Tuesday morning up and down the New Jersey shore.

Historical storm surge occurred after the system made landfall, as high tide juxtaposed with hurricane force southeast gales. This pushed a wall of water into the south shores of Long Island and New York Harbor. Record storm tide levels were reached at The Battery, where the water reached nearly 14 feet. The previous record stood at 10.1 feet. The surge in the Hudson and East rivers sent water pouring into the streets of mid and lower manhattan. The rivers also spilled into Jersey City and Hoboken. Significant flooding was observed in the subway stations near and underneath the East River. The subway system may inoperable for weeks.

The southeasterly gales also brought a wall of water to the south facing shores of Long Island, Long Beach, the Rockaways, South Brooklyn, as well as many other locations which saw the water pour into the streets from the beach.

Winds: Hurricane force wind gusts were widespread throughout the area — almost everyone experienced them at some point. Arguably the strongest winds occurred after the system was near landfall, as mixing improved in the low levels of the atmosphere with cold air advection beginning as the system transitioned to post tropical. This was a disaster waiting to happen, as strong winds were ripping just above the surface and could not more effectively mix down to the surface. Gusts of near 90 miles per hour were reported at many official stations in the NYC Area — unprecedented.

The winds downed thousands of trees in towns and transformers were seen flashing in the sky, exploding as trees and branches fell on power lines and winds continued. The winds also attributed to what will eventually be seen as one of the most severe beach erosion episodes in history.

We compiled as list of some of the highest wind gusts in the area:

Eatons Neck, LI – 96 mph
Islip – 90 mph
Montclair- 88 mph
Madison (New Haven) – 86 mph
Kennedy Airport – 79 mph
La Guardia Airport – 74 mph
Central Park – 62 mph

Flooding Rain: The flooding rain was not as much of an issue over Northern NJ and NYC as it was over Southwestern New Jersey. The flooding (rain aside) was tremendous in response to the aforementioned storm surge and winds. Thousands of homes are destroyed, millions are without power.

Was this storm everything we expected it to be? Yes, and the damage more than we thought it would be. The storm was historic in many aspects — and the billion dollars of damage it caused, and effect it had on people’s lives, is remarkable

Will we see something like this again? Not likely for a very, very long time. The storm you just witnessed was a once in a century type storm. It required a specific set of events to go completely according to plan in exact order, and certain atmospheric variables needed to be perfectly in place. As a meteorologist, watching this unfold was truly remarkable and humbling. But most importantly, I hope that in disseminating the information we did, that we helped to keep you informed and prepared..and hopefully saved lives.

To all affected, wish you all the best.

What caused the tornado warnings in New Jersey on Tuesday?

RAP 850mb Analysis for 00z Wednesday, September 5th or 8pm EDT Tuesday, September 4th 2012.

“Tornado Warning” has always been an ominous phrase. When you hear those words, things generally tend to get a little more serious. On Tuesday, there were more than three Tornado Warnings issued throughout the state of New Jersey, beginning in the afternoon and continuing into the evening hours. Although the area did not see much in the way of severe weather reports in a quantitative sense, there were several reports of low-level mesocyclones, funnel clouds, and even tornadoes in the general extreme Eastern PA and NJ areas. In hindsight, this was actually a pretty good setup for low-level mesocyclones and tornadoes, and I’ll explain why.

Synoptically, we had a surface low that slowly deepened to around 1006mb located in Western Upstate New York, along with a closed 850mb low located in the same area. This placed our area in a pressure trough, and also resulted in a warm front that moved to the north across our region. Warm fronts are generally a better lifting mechanism for rotating thunderstorms than cold fronts. This closed 850mb low helped to provide a nice low-level jet, as 850mb winds were around 30 knots in most locations.

Additionally, there was some helicity as well, which is an indicator of rotation in the low levels of the atmosphere. What is also interesting to note is the light SE surface winds, and the importance of that will be explained in a bit. Click “Read More” below to read the full article..

Read more