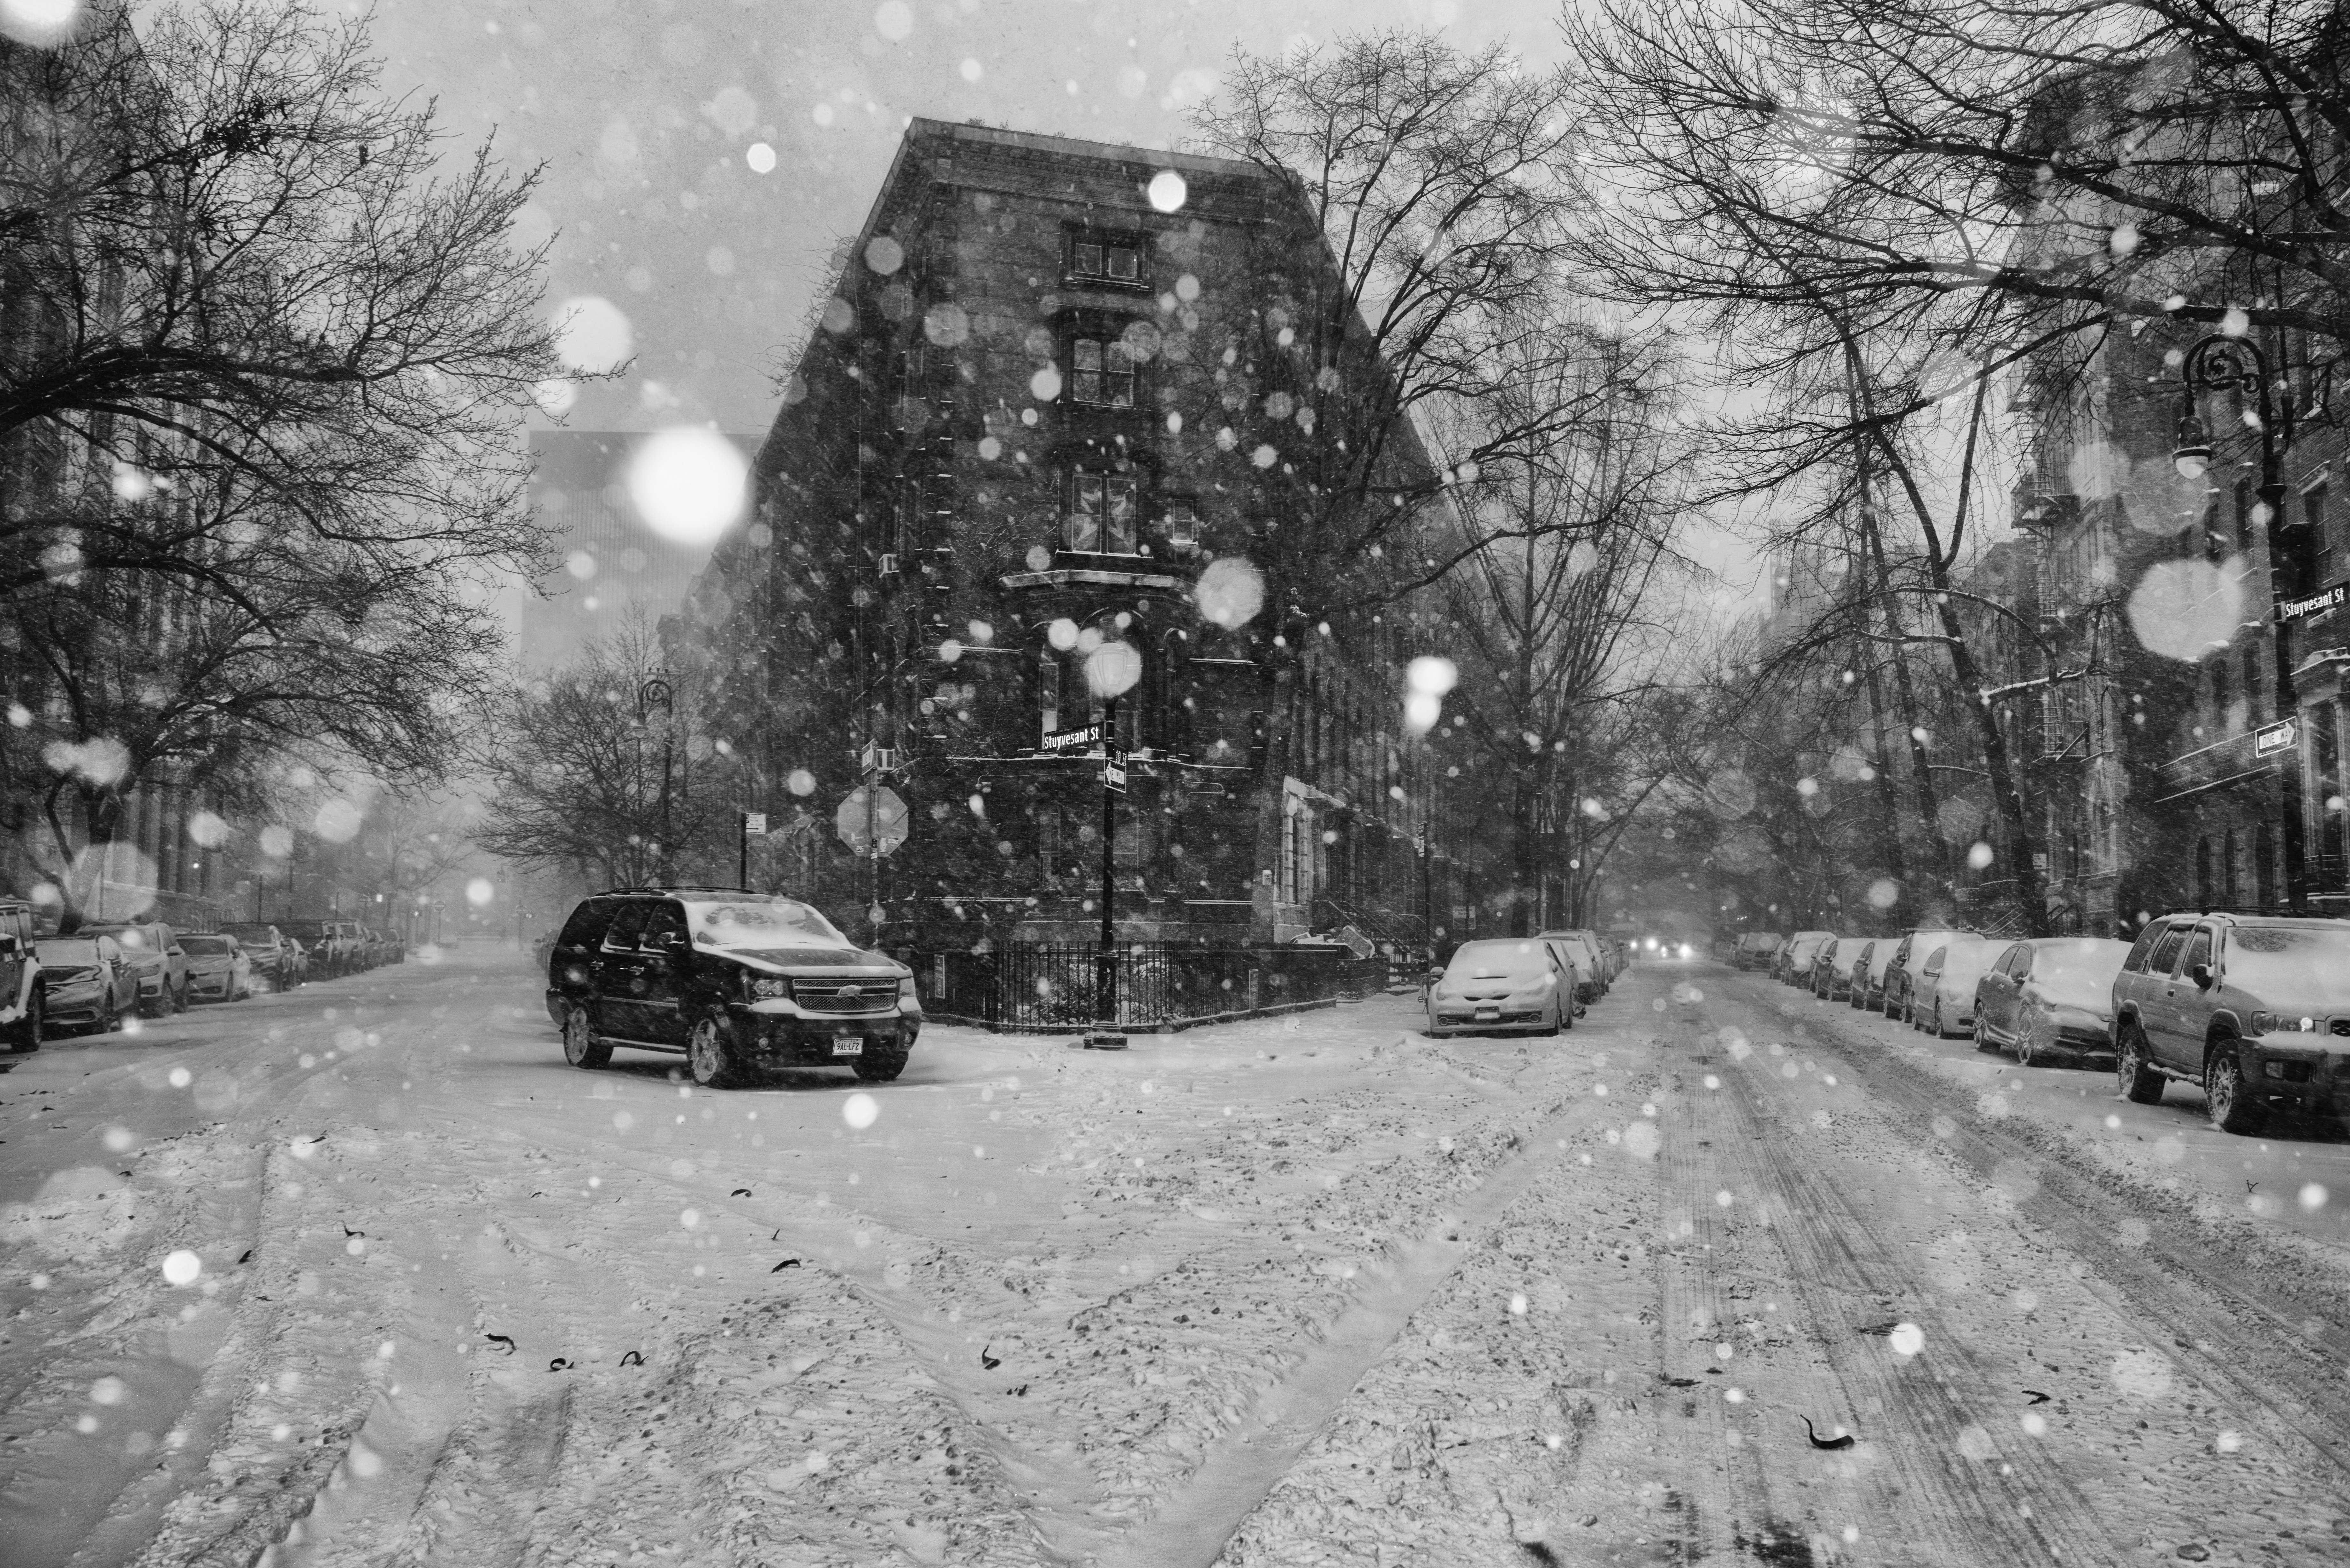
A significant winter storm will impact the Northeast and parts of the Mid Atlantic from Sunday through Tuesday morning, with multiple rounds of snow expected. The heaviest snow is expected to fall in interior portions of the Northeast and throughout New England. The storm systems evolution remains extremely complex and will present forecasting challenges right up until snow is falling.
https://www.nymetroweather.com/wp-content/uploads/2019/11/joseph-pearson-FRx3dQj6iYg-unsplash-1-scaled.jpg17072560John Homenukhttps://www.nymetroweather.com/wp-content/uploads/2024/02/Empire-2000-x-300-px-2.pngJohn Homenuk2019-11-30 13:09:372019-12-18 16:01:00Seasons first snowfall expected in NYC, worst stays in the interior
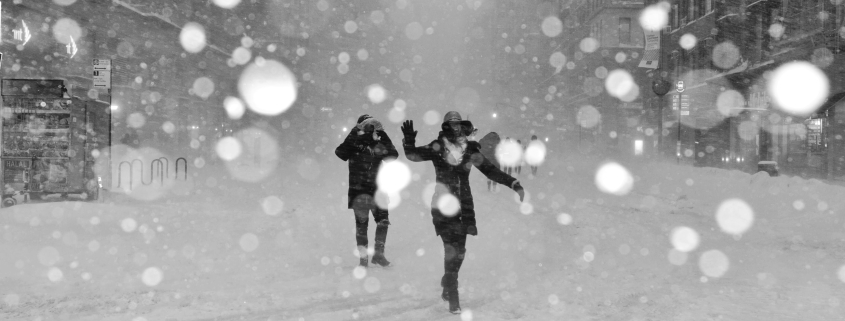
It was around 3:00pm that things got serious. After days of forecasting light to moderate snowfall accumulations, followed by a transition to rain, a winter storm was over-performing at the worst possible time. It was November 15th, 2018, and the hours that followed would by marked by some of the worst road conditions the NYC Metro has seen in a decade.
Commuters were stuck in traffic for more than five hours. Some of them never got home. Snow piled up on roadways, which became impassable as heavy precipitation continued to fall. Public transportation was overwhelmed. The system which we rely upon so heavily to commute and travel around the city seemed to collapse in a cascade of failures as a result of heavy snowfall.
And it all began with a poorly communicated weather forecast.
“This one has bust potential”
Days before the commute from hell began, meteorologists were honing on the potential for an early-season winter storm in the Northeast states. This time of year, particularly November, is very challenging for weather forecasters. The atmosphere is in a transition between the summer and winter jet stream patterns. This causes more chaos than usual in the atmosphere, and forecast models can struggle as a result.
This one, however, seemed fairly straightforward at the start. The storm was characterized by a process called warm air advection which is as aptly named as it sounds. The movement of warm air in the low and mid levels of the atmosphere acts to enhance lift, resulting in moderate to heavy precipitation. Winter storms that are driven by warm air advection are often marked by the change from snow to rain, as the warm air eventually takes over and melts the snowflakes before they reach the ground.
One of the major questions with Thursday’s winter storm will be this band of heavy precipitation that approaches during the afternoon/evening. A cold airmass in place and impressive dynamics in the atmosphere suggest wintry precipitation – but exact type is yet to be determined. pic.twitter.com/zeLTJUD2SK
This process was part of the foundation of the forecast in the days leading up to the event. However, a strong high pressure to the north of the storm led to unusually low confidence. The battle between the warm air advection surging from the south and the high pressure filtering cold from the north meant that a tiny change in either direction could unhinge the entire forecast.
In an article published a few days before the storm, we noted this exact uncertainty. In our office, the remark that kept coming up was “this one has bust potential”. In other words, we were worried about the storm surprising us at the last moment. That would be an understatement.
All of the red flags were up, they were just ignored
As the storm system drew closer, all of the flags that should have been up – the signs that this system would surprise us – were there. The day before the storm, almost all models including the ECMWF, NAM and GFS trended colder with surface temperatures across the Northern Mid Atlantic and New England. The high pressure to our north was over-performing.
Forecast models trended colder and snowier the morning that the event began to unfold.
It was at this point that there was a critical error in communication between meteorologists and operations managers around the NYC Metro Area. This is the inflection point where communication absolutely needed to change. It was clear that this event had the potential to over-perform and that winter weather impacts had the potential to be higher than expected. All of the red flags were up, they were just ignored.
The next few hours would seal the fate of the evening commute. As snow started throughout the area, it was far too late for operations managers, DOT’s and other local services to react. The roads were not properly treated and were not ready for the incoming heavy snow rates. Meteorologists and local services had failed.
Heavy snow began to spread over the entire NYC Metro Area and surrounding parts of NJ, NY and CT. With the high pressure to the north over-performing, and more cold air available than initial anticipated, the atmosphere was able to reach a crescendo of heavy snow. Warm air advection continued to enhance precipitation, but cold air to the north kept reinforcing itself and allowing dynamic cooling to produce snow – not rain. Such a process is not unheard of, but was extremely impressive for early in the season, let alone the middle of November.
Precipitation has changed to rain in some places, but remains a mix in the suburbs and inland. Travel conditions have not improved at all. Just stay off the roads if you can. pic.twitter.com/NrImN8EenW
Roads quickly became an absolute nightmare with untreated pavement being impacted by very heavy snowfall rates. Travelers were stuck on roadways for 5-10 hours (sometimes more), accidents were common, public transportation was stymied and commuters were completely stranded. NYC ended up with 6.4″ of snow, the second snowiest November day on record.
What to learn and how to move forward
Meteorology has come a long way, but we still have a long way to go.
We knew of the potential impacts from this storm several days in advance. The risk of potential hazardous weather was communicated. Yet, at the last moment, a change in the expectations of the storm resulted in a catastrophic failure of preparation. Why was this change not communicated? How was there not a backup plan in place?
As meteorologists, our job is to properly communicate the expected impact from a storm system. But in 2019, our job should go beyond that. All meteorologists, especially those working closely with government and local officials that are responsible for DOT’s or local services, should be responsible for detailed and responsible communication of risks.
It is not irresponsible for meteorologists to admit that a certain storm system has a higher “bust” potential. It is not irresponsible for meteorologists to admit that they don’t have a full handle on exactly what is going to happen. It is not irresponsible for meteorologists to admit that a forecast is going off track and needs to be adjusted. Perhaps such an approach would’ve helped in November of 2018.
Think of it this way: If we communicate that 3-6″ is the expected accumulation amount, but that the storm is extremely complex and has the potential to produce more snow, it’s more likely that local agencies will act in an abundance of caution. We can sound that alarm bell as the storm approaches as needed, and the appropriate actions can be taken. If that risk is never communicated, however, the local agencies have no chance to react.
Ultimately, we don’t truly know exactly what went on behind this scenes. We don’t work with the NYC DOT (yet?), and we don’t know how the forecast was communicated. But we can speak for meteorologists when we say that communicating uncertainty in a forecast needs to become a standard procedure.
Our hope is that during the Winter ahead, we’ll begin to see some of these lessons learned in action. We want to communicate risk and uncertainty properly so that our readers (and clients) can act appropriately. That’s how meteorology communication will improve, and that’s how we can prevent a disaster like November of 2018 from occurring again.
Here’s hoping that the first winter storm of 2019-2020 doesn’t end the same way this one did, so that we can all enjoy the snow from somewhere comfortable and warm.
https://www.nymetroweather.com/wp-content/uploads/2019/11/jeffrey-blum-sLlZmxchhYw-unsplash.jpg49127360John Homenukhttps://www.nymetroweather.com/wp-content/uploads/2024/02/Empire-2000-x-300-px-2.pngJohn Homenuk2019-11-15 09:32:042019-11-15 09:32:14Reflecting on a mid-November forecasting nightmare
We say it every year, but it’s worth repeating: Seasonal weather forecasting is one of the most challenging aspects of meteorology. It isn’t simply a guesstimate or an educated gamble. It is, instead, the product of months of research which typically begins at least two seasons prior. We’ve been piecing together ideas for this upcoming winter since Spring, and we are excited to present our findings to you. In that respect, we are hopeful to break down the components of the forecast in an easy to understand fashion in our NYC Winter Forecast.
Instead of focusing on individual numerical indexes and values, we are going to try to paint a picture of the atmosphere and what it will be doing over the next few months – based on several global and hemispheric oscillations, conditions, and phenomena. This will lead us to the conclusions which we believe will be the guiding forces for us during the seasons ahead.
There are three main pieces to a seasonal forecast, and while each year presents a different set of challenges, from a forecasting perspective these three pieces almost always remain engraved in the process. We must look at current conditions, analog years, and forecast guidance for the upcoming months to begin our forecast.
Most notably, perhaps, is the fact that this high latitude blocking also had not been observed in quite some time, especially over such a long duration. This summer, we recorded one of the longest -NAO periods on record.
Such a change in the high latitudes certainly needs to be factored in to the Winter Forecast and we perused all of the available data to weight and rationalize our forecast properly.
The role of ENSO in the upcoming Winter 2019-2020
Anticipated ENSO Conditions: Neutral to Weak El Nino
ENSO conditions are one of they key drives to the Winter pattern. “Tropical forcing” refers to concentrated areas of showers and thunderstorms, otherwise referred to as convection, in meteorological regions of the tropics. This convection, most frequently observed in warm and moist climates, releases latent heat that then rises up into the atmosphere, forming ridges of higher atmospheric air pressure.
The equatorial waters of the Pacific ocean that comprise the ENSO regions breed a great deal of convection, which then accordingly results in atmospheric ridging, and subsequently moves downstream, balancing the atmospheric regime. In a general sense, the more anomalous the positive sea surface temperature anomalies, the more convection that can then exert a stronger forcing mechanism on the adjacent regions of the atmosphere, reverberating throughout the globe.
We anticipate weak-neutral to weak El Nino conditions during this Winter 2019-2020. These conditions were factored in to our Winter Forecast and our analogs were weighted and sorted accordingly. It is important to note that there is a great deal of variability among analogs as a result of the weak ENSO signal this year.
The El-Nino that develops over the next few months may be of the Central Based nature – with the majority of the warming taking place in Central regions of the tropical Pacific. It is important to note that this is different from a “Modoki” El Nino – which by definition also features some cooling in the Eastern Tropical Pacific Ocean.
Central Based El Nino events have a very different subset of effects when compared to basin-wide or especially Eastern Based El Nino Events. In general, they are cooler across the country in comparison, but particularly in the Eastern United States. There are still a few weeks to go before we will know with greater certainty how the ENSO conditions will evolve. Close monitoring of both the current conditions, subsurface warming and depth will be critical.T
The Quasi-Biennial Oscillation (QBO) this winter
Prediction: Descending easterly -QBO
The QBO is a very important atmospheric index which monitors the quasi periodic oscillation between the equatorial zonal wind – from easterlies to westerlies. A negative QBO often supports higher latitude blocking and ridging, while a more positive QBO supports some resistance to high latitude blocking in those areas.
Recently, a negative (easterly) QBO has been descending toward 30mb. This is an important factor in the Winter ahead, but it is uncertain how quickly the easterly QBO will continue to descend. We used a split analog package as there are only a limited number of QBO analogs which compare to the evolution so far this year.
Other Factors (PDO, Solar Activity, etc)
There are many other factors that go in to producing a Winter Forecast. We try to weight and balance our forecasts based on a variety of subjects. For example, this year the PDO (Pacific Decadal Oscillation) is at -0.66, but is displaying some characteristics more typical of a +PDO. We must weight our analogs accordingly.
Solar activity is at a near 10-year minimum this year, which certainly will be factored in to the forecast as well. But all of these things tie back to the proper weighting of analogs to get an idea of exactly how the atmosphere is behaving.
Analog years are an important component to winter forecast development. Looking back to past years that featured similar atmospheric progressions and conditions can offer us a peak into how things may evolve in the winter ahead. We can appropriately weight these based on our understanding of the atmosphere during those years and how it compares to current conditions.
The usage of analog years in a Winter Forecast has been long debated and discussed. How much should a forecaster weigh what happened in the past against what is happening currently? How can we utilize past events when the atmosphere is almost certain to behave differently each time, especially given the difference in global weather when compared with weather events from the 1950’s and 1960’s? The answer lies in forecaster preference, and as is the case with most things, how a forecaster weights and blends different components into the forecast will have a huge impact on the end result.
For us, each winter is different. This year in particular, the number of analog years that fit the set of conditions and the overall progression of the atmosphere is very slim. With that in mind, we decided to weight the analog years in our forecast very carefully, taking only the stronger year(s) and blending quickly downward toward the weaker analogs. We are comfortable with our analog composites that were presented and have factored them into our forecast as we typically do – simply a piece of the larger forecasting puzzle.
When we take the individual pieces of research and compile them into one organized forecast, we can begin to see the ebbs and flows of the winter ahead – as they should be, according to our very best analogs and subset of current and past conditions. This winter, we are confident in our month-to-month composites and have indicated moderate to high confidence on each month.
Below, we break down each months temperature and anticipated precipitation trends. While precipitation maps are not included (lower confidence) we discuss precipitation pattern and potential within each individual months breakdown. Please keep in mind, this is a NYC Winter Forecast, but we do discuss national trends and weather patterns as well!
December 2019
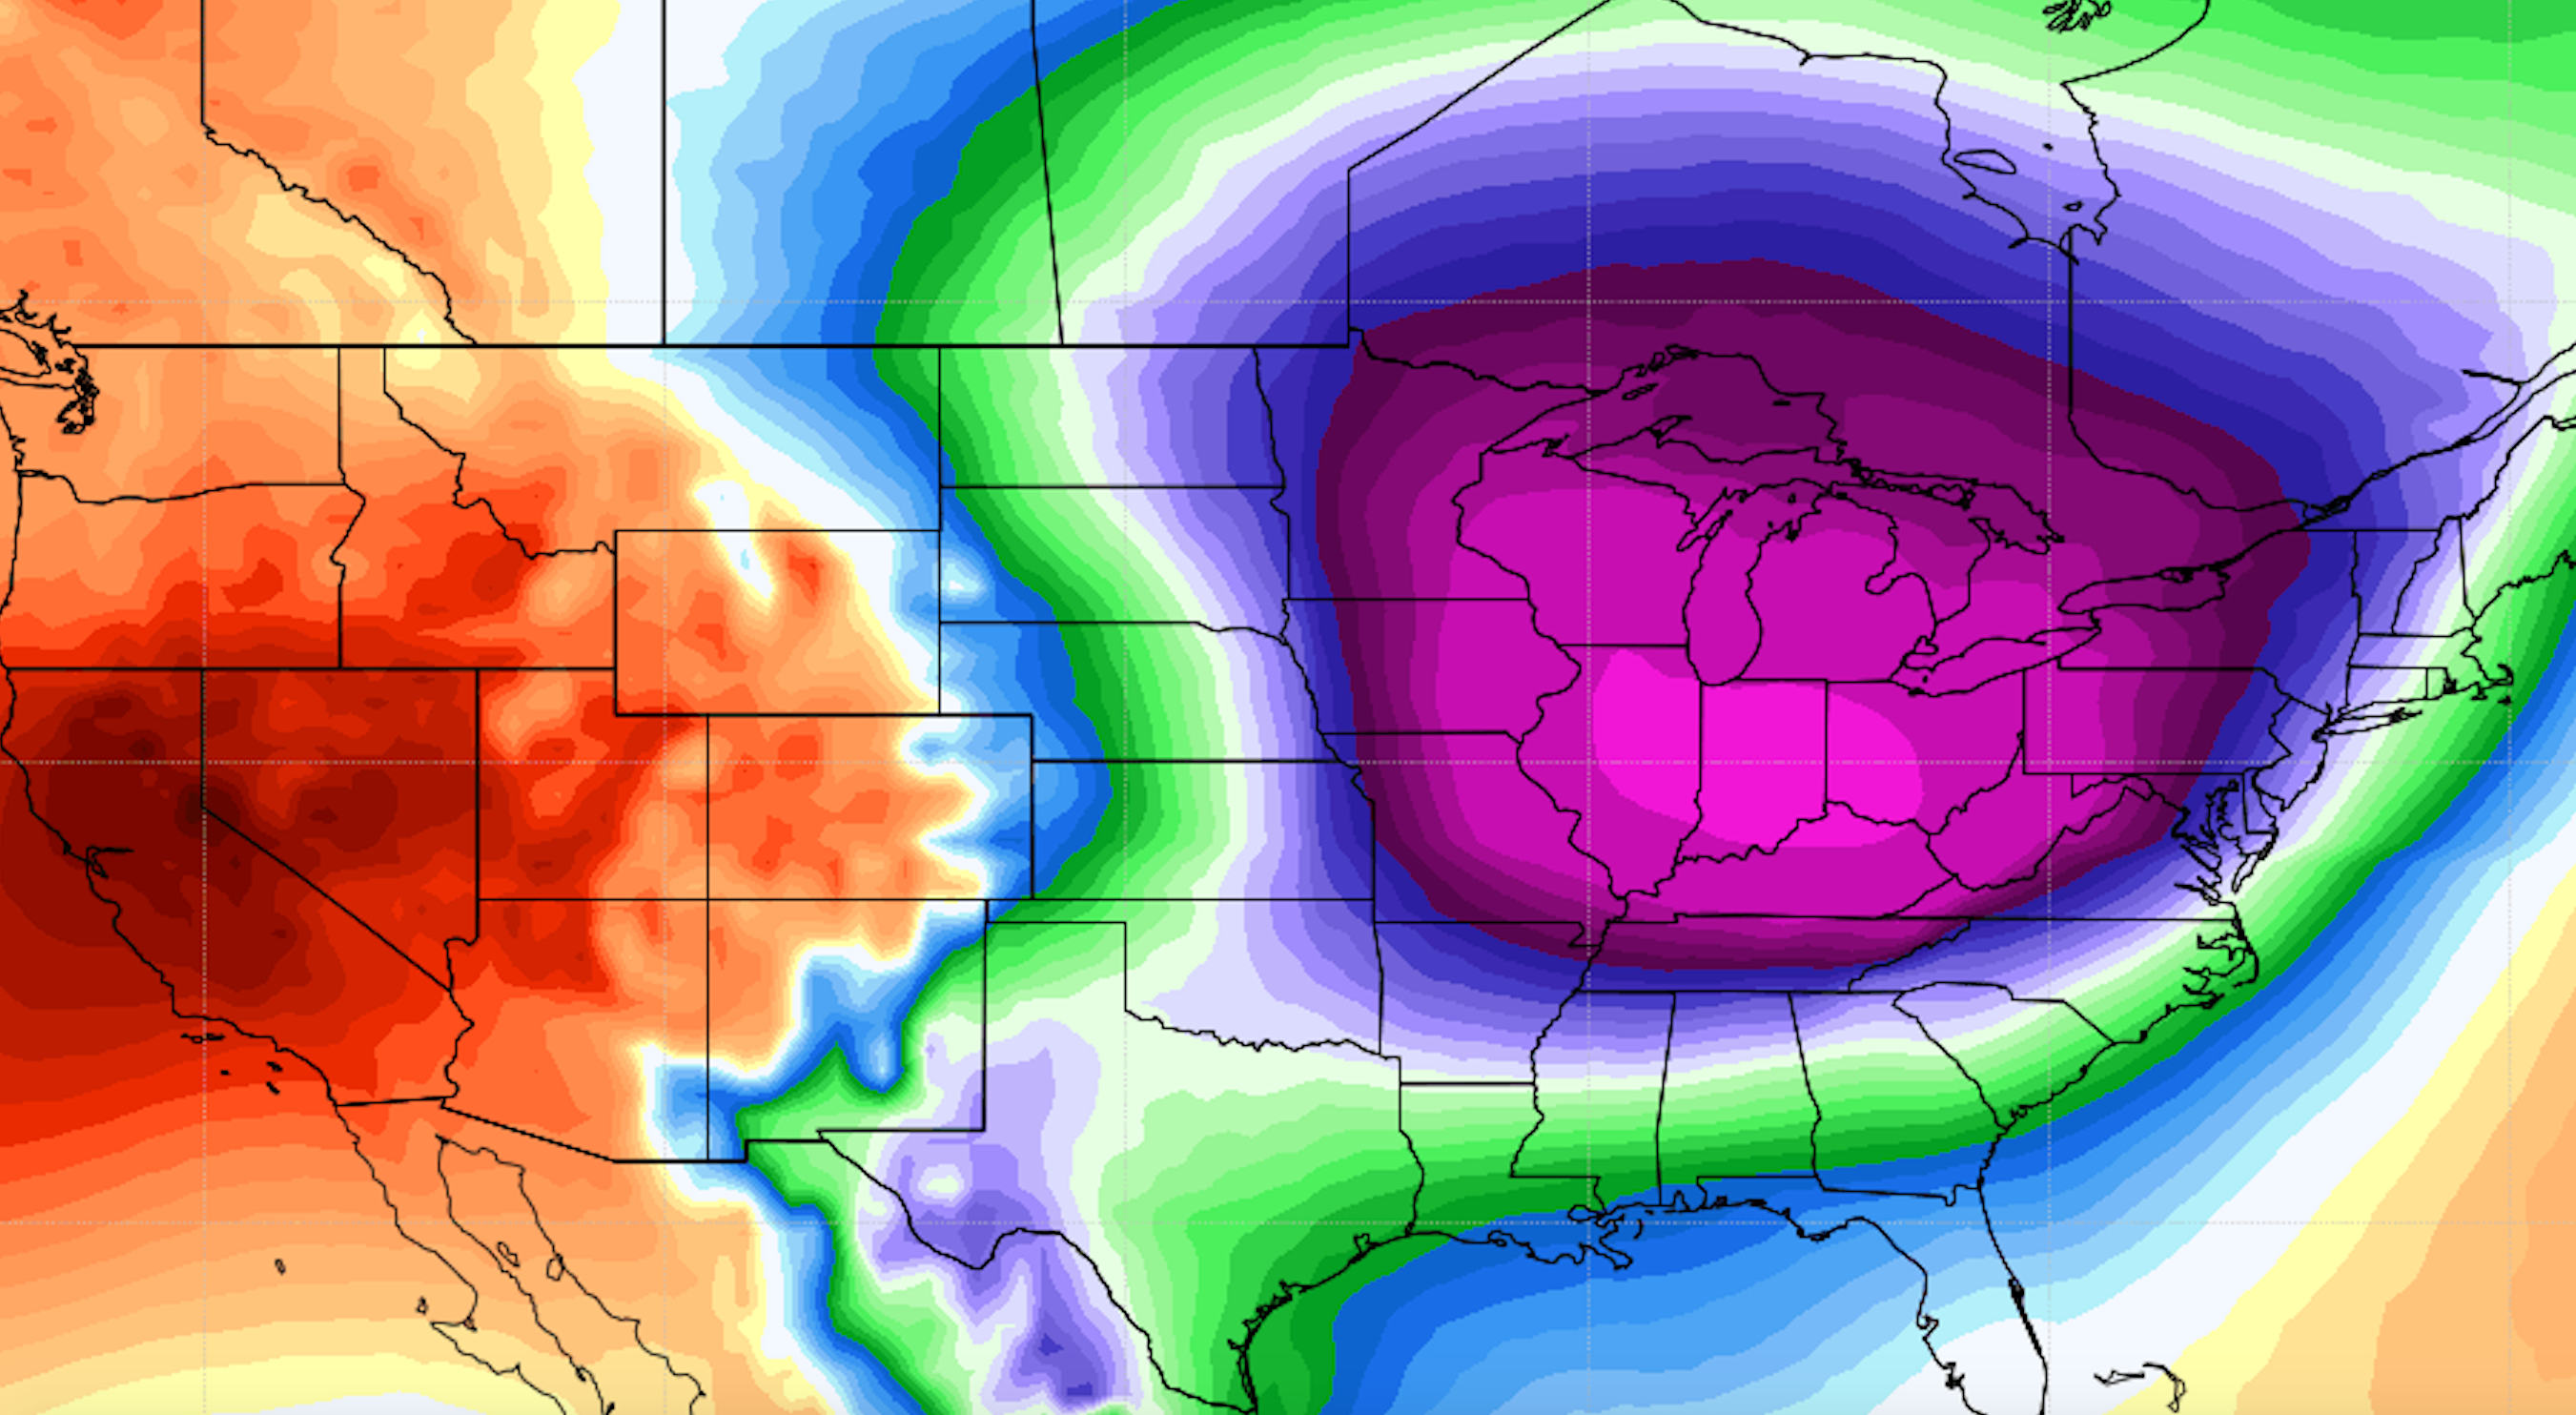
December 2019 is expected to feature an expansive Southeast Ridge with warmer than normal temperatures across much of the Southeast United States. Warmth should also spread northward into the Mid-Atlantic States at times, as well as into New England.
The majority of cold risks will be centered in the Northern Plains, where occasional cold shots are likely. It remains to be seen exactly how impressive these cold shots will be, and uncertainty is rather high – precluding any more impressive temperature anomaly forecasts there.
The main area of uncertainty is over New England. The development of a -NAO by mid to late month could favor some colder temperatures in those regions, which may ultimately adjust the monthly average composites. However, we do not expect December to be an overly wintry month in the Northeast states at all.
January 2020
Winter is expected to evolve more dramatically during the month of January, with the potential for further episodes of high latitude blocking on both the Pacific and Atlantic sides of the arctic. This should dislodge cold air southward into Canada and the United States.
Below normal temperatures are expected on the monthly composites across the Northern Plains and parts of the Ohio Valley and Northeast. Periodic expansion of the Southeast Ridge should keep parts of that area above normal with temperatures even on a monthly basis.
Snowfall is expected to average near or slightly above normal in the Midwest, Great Lakes and Northeast during January – which will feel active compared to the slow start in December.
February 2020
As you may expect at this juncture, confidence is lowest in regards to February when compared to any other month. With that being said, our forecast carries forward the expectation that high latitude blocking will continue to remain prevalent during this month. Colder than normal temperatures are expected across the Great Lakes and Northeast as a result.
Snowfall should again average near or slightly above normal in parts of the Great Lakes, Ohio Valley and Northeast, with a specific emphasis on New England where snowfall may end up solidly above average.
Much of the Western USA is expected to be warm during this month as ridging remains stout.
NYC Winter Forecast 2019-2020 Highlights and Summary
We expect Winter 2019-2020 to start rather slowly, although there is a window for some wintry weather in very early December. The month will largely be characterized by bouts of warmth along the East Coast. The greatest potential for winter weather during December will exist across the Plains and Midwest.
Gradually, as we move through January, Winter will pick up steam with a colder and snowier pattern becoming established. This may continue into February.
Our current expectation is for temperatures to average near or slightly above average in NYC, with near or slightly above average snowfall.The worst of the Winter will likely be observed from mid to late January into early February.
We wanted to take the time to thank you for reading our 2019-2020 Winter Forecast. The forecast was compiled at Empire Weather, LLC and New York Metro Weather, LLC in Fanwood, New Jersey from May of 2019 through October of 2019. The graphics were compiled by John Homenuk. Analog work and composition was completed by John Homenuk, Ed Vallee, Doug Simonian and Miguel Pierre. The presentation was compiled and edited by John Homenuk, Ed Vallee and Doug Simonian. Additional forecast feedback, commentary and production was provided by Steve Copertino.
Each year, we are fortunate enough to produce and release a Winter Forecast both to clientele and to the public. We are grateful for the opportunity to share our forecast with as many people as we can – and we hope to deliver a forecast that provides detail, information and clarity.
Here’s to a wonderful Winter ahead! PS – Don’t forget to check our daily forecast page here.
It’s the headline you’ve been dreading since you sat in traffic for 5 hours during last November’s snowstorm. Much colder, potentially wintry weather is poised to move into the Northeast states later this week, with additional shots of cold air continuing through next week.
https://www.nymetroweather.com/wp-content/uploads/2019/11/Screen-Shot-2019-11-06-at-8.32.04-AM.png14842702Miguel Pierrehttps://www.nymetroweather.com/wp-content/uploads/2024/02/Empire-2000-x-300-px-2.pngMiguel Pierre2019-11-06 08:36:212019-11-06 08:45:57Colder, potentially wintry weather pattern poised to take over
Hi friends! Our website uses cookies to provide an optimal browsing experience for you. New "Cookie Consent" laws mandate us to inform you of this. As long as you're cool with it, just hit OK. You'll only see this message once.
We may request cookies to be set on your device. We use cookies to let us know when you visit our websites, how you interact with us, to enrich your user experience, and to customize your relationship with our website.
Click on the different category headings to find out more. You can also change some of your preferences. Note that blocking some types of cookies may impact your experience on our websites and the services we are able to offer.
Essential Website Cookies
These cookies are strictly necessary to provide you with services available through our website and to use some of its features.
Because these cookies are strictly necessary to deliver the website, refusing them will have impact how our site functions. You always can block or delete cookies by changing your browser settings and force blocking all cookies on this website. But this will always prompt you to accept/refuse cookies when revisiting our site.
We fully respect if you want to refuse cookies but to avoid asking you again and again kindly allow us to store a cookie for that. You are free to opt out any time or opt in for other cookies to get a better experience. If you refuse cookies we will remove all set cookies in our domain.
We provide you with a list of stored cookies on your computer in our domain so you can check what we stored. Due to security reasons we are not able to show or modify cookies from other domains. You can check these in your browser security settings.
Other external services
We also use different external services like Google Webfonts, Google Maps, and external Video providers. Since these providers may collect personal data like your IP address we allow you to block them here. Please be aware that this might heavily reduce the functionality and appearance of our site. Changes will take effect once you reload the page.
-2")