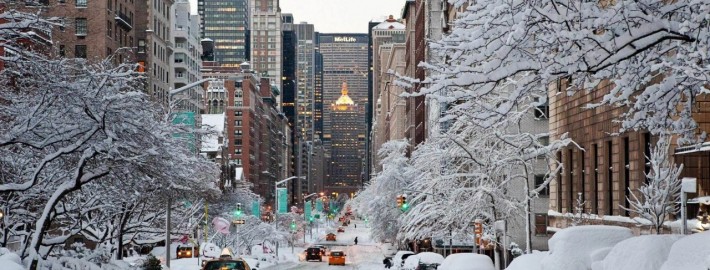
We made it! We can finally safely say that the winter season is over and, while the cold seems to want to endlessly stick around, Spring is strengthening its grasp. Now that the days of snow and bitter cold are over, we’ve compiled a detailed review of the brutal winter as well a verification for ourwinter forecast we issued back in early November.
Some highlights of this winter include:
1) The second coldest February on record, with widespread ice buildup on the Hudson River.
2) Winter storm “Juno” in late January which gave parts of eastern Long Island over two feet of snow.
3) A persistent cold and snowy pattern from late January through March, with an active assault of moderate snow events — somewhat reminiscent of last year’s winter.
4) Boston’s snowiest winter on record.
In our review, we break down the winter month-by-month and provide temperature departures and snowfall amounts for Central Park, as well as descriptors and verification statistics.
Primary Methodologies and Variables of Examination
El Nino Southern Oscillation (ENSO)
North Atlantic Oscillation (NAO)
Arctic Oscillation (AO)
East Pacific Oscillation (EPO)
Siberian/Eurasian Snow cover and Stratospheric Warming
October Greenland Blocking
Pacific Decadal Oscillation (PDO)
Sea Surface Temperature Anomalies (SSTA)
Explanation of Variables
Over the past several months, our forecasters have monitored the above variables (plus others) and the trends in their behavior. We will be utilizing the above variables and indices, as well as their abbreviations, throughout the winter forecast. These variables reflect the atmospheric circulation patterns for certain geographical areas. For example, the AO refers to patterns within the Arctic Circle. The NAO refers to pattern characteristics in the North Atlantic, the PNA in the western part of North America, the PDO in the Pacific Ocean, and the EPO in the Northern and Eastern Pacific Ocean.
Typically, negative AO, NAO and EPO values correlate to enhanced high latitude blocking and high pressure to our north while lower pressure areas and troughs usually form underneath that high latitude ridging in the middle latitudes. In contrast, positive AO, NAO and EPO values generally yield lower pressure and less blocking to our north, while higher pressure and more ridging tends to build into the middle latitudes. There are exceptions to the rule, but generally the negative state of the above listed indices yields colder, more snowy weather in our area during the winter months.
Seasonal Forecasting Brief
Seasonal forecasting is one of the most convoluted aspects of meteorology. Not only is it a difficult task for the meteorologists themselves, but it is difficult for readers and public viewers to understand the nature of the forecast at times. The root of the problem lies in the fact that seasonal forecasting is based on many different methods — all of which have tremendous variability and low percentage verification. Seasonal forecasting begins with an analysis of current conditions and atmospheric circulations, similar to any daily forecast. Beyond this point, forecasters use variables such as sea surface temperature anomalies, analogs, and comparative methodology.
Some forecasters have detailed the mentality very well when they have stated that long term forecasting is very much about “What can go wrong” as opposed to “How will my forecast be correct”. Our job as meteorologists is to detail the aspects that have formed the foundation for our forecast, express our concerns and confidence in all aspects, and try to deliver the ideas which we have formulated as a result of our research and work in attempting to understand the patterns evolution over the next several months.
We will begin by highlighting several variables which we have researched. Each variable will be listed with a conclusion and prediction on its state during the winter, as well as the methodology and reasoning behind that forecast.
As the Spring season moves along, signs begin to become more clear regarding the development of an El Nino. Although there has been relatively high confidence in the development of an El Nino for quite some time, there was still a small bit of doubt, as some expressed skepticism. However, over the last month or so, the atmosphere has undergone changes which should remove any seeds of doubt regarding whether an El Nino will be developing this Spring and Summer. The only doubts that exist now is the final strength of the event (El Nino events usually peak in the Autumn): high-end moderate/low-end strong, a strong event, or a super strong event. For more information regarding the formation of El Ninos and what they mean for our weather pattern, check out the article we published last month.
What has happened that makes us so confident? The easterly trade winds which usually keep warm water well to the west towards Indonesia have shifted to westerlies.
This animation shows the progression of the strength and direction of wind currents. Note how they started off blowing from east to west (easterlies, blue arrows), but have dramatically shifted in the opposite direction (westerlies, red arrows). This is a strong indicator that an El Nino is coming. Click to animate.
This means that the base state of the atmosphere which prevents El Nino events has completely changed to one that favors El Nino events. The typical climate pattern has easterly trade winds along the Equator, which blow warm water along the Equatorial Pacific to the west, towards Indonesia and Australia, leaving the rest of the Equatorial Pacific relatively chillier. Now that the surface currents have shifted to blowing from west to east, it becomes much easier for that same warm water from the west to move eastward throughout the rest of the Equatorial Pacific, leading to an El Nino.
https://www.nymetroweather.com/wp-content/uploads/2014/05/161.gif329810Doug Simonianhttps://www.nymetroweather.com/wp-content/uploads/2024/02/Empire-2000-x-300-px-2.pngDoug Simonian2014-05-12 07:00:352014-05-12 13:21:01El Nino Update: Not a matter of if, but how strong
While our area has been enjoying a stretch of pleasant and warmer weather, many meteorologists and weather hobbyists alike have been analyzing interesting data in the Equatorial Pacific: signs of a developing El Nino. An El Nino is generally defined as a trimonthly period where waters in the Equatorial Pacific — from 160 Degrees East to 80 Degrees West Longitude — are warmer than normal. This tends to have effects on the general atmospheric circulation, which will be detailed in this article. The Climate Prediction Center breaks this area into four different Nino regions, since warm anomalies in different regions of the Equatorial Pacific can lead to subtle, yet important changes in how the El Nino behaves.
The four El Nino regions (NCDC).
The region used to officially define an El Nino event is Nino 3.4, which spans from about 170 Degrees West to 120 Degrees West. That is not to say that the other regions are not important; they are just not used in the official calculation. Let’s take a look at an example of an El Nino event:
The strong El Nino event of 1997-1998. Notice how warm the waters are in the eastern Equatorial Pacific (CPC).
The El Nino of 1997-1998 was the strongest on record, as it had temperature anomalies between +2C and +5C across the eastern Equatorial Pacific. Also notice how the warmest anomalies were east of Nino region 3.4, which is a classic strong El Nino phenomenon. Let’s see how the forecast from one of our climate models compares to the 1997-1998 event.
The latest CFS model run shows an El Nino emerging (CPC).
The values on the left are anomalies in Kelvin, which can also be represented by degrees Celsius, since the incremental increases are the same for Kelvin and degrees Celsius. On the bottom, we see tri-monthly periods. The wavy black line shows what had previously been happening — generally, there was no anomaly at all, indicating no El Nino, nor its counterpart, a La Nina. However, moving forward in time, notice how all of the lines, which represent forecasting members, show a pretty fast increase in the anomaly through the coming months. Another interesting point is how the red lines are the earlier members, and the blue lines are the latest members — and there appear to be more blue members hedging towards the warmer side of the mean than the red lines — which is perhaps an indicator of a further warming trend.
The threshold for a strong El Nino is an anomaly of +1.5C or higher, which certainly seems attainable according to the CFS. While not nearly as strong as the 1997-1998 El Nino, it would certainly still be pretty strong, and the fact that the latest members look warmer than the mean indicates that the El Nino could verify warmer than the forecast mean.
Now that we know what an El Nino is, as well as how strong it is forecast to become, let’s examine what causes an El Nino, and what effects it has on our weather pattern. Read more
https://www.nymetroweather.com/wp-content/uploads/2024/02/Empire-2000-x-300-px-2.png00Doug Simonianhttps://www.nymetroweather.com/wp-content/uploads/2024/02/Empire-2000-x-300-px-2.pngDoug Simonian2014-04-10 17:48:522014-05-12 06:55:49Moderate to strong El Nino becoming increasingly likely
Hi friends! Our website uses cookies to provide an optimal browsing experience for you. New "Cookie Consent" laws mandate us to inform you of this. As long as you're cool with it, just hit OK. You'll only see this message once.
We may request cookies to be set on your device. We use cookies to let us know when you visit our websites, how you interact with us, to enrich your user experience, and to customize your relationship with our website.
Click on the different category headings to find out more. You can also change some of your preferences. Note that blocking some types of cookies may impact your experience on our websites and the services we are able to offer.
Essential Website Cookies
These cookies are strictly necessary to provide you with services available through our website and to use some of its features.
Because these cookies are strictly necessary to deliver the website, refusing them will have impact how our site functions. You always can block or delete cookies by changing your browser settings and force blocking all cookies on this website. But this will always prompt you to accept/refuse cookies when revisiting our site.
We fully respect if you want to refuse cookies but to avoid asking you again and again kindly allow us to store a cookie for that. You are free to opt out any time or opt in for other cookies to get a better experience. If you refuse cookies we will remove all set cookies in our domain.
We provide you with a list of stored cookies on your computer in our domain so you can check what we stored. Due to security reasons we are not able to show or modify cookies from other domains. You can check these in your browser security settings.
Other external services
We also use different external services like Google Webfonts, Google Maps, and external Video providers. Since these providers may collect personal data like your IP address we allow you to block them here. Please be aware that this might heavily reduce the functionality and appearance of our site. Changes will take effect once you reload the page.
-2")